![]()
FishSOOP (Fishing vessels as Ships Of Opportunity Program) turns everyday fishing activity into ocean science fieldwork. By attaching small sensors to commercial fishing gear or equipment operated by citizen scientists, FishSOOP collects measurements of sea temperature at depth in coastal waters on and off the continental shelf.
All data are quality-controlled and made available open source through the Australian Ocean Data Network (AODN) data server, where you will find data from 2021 to nearly real time. FishSOOP provides unique insights into ocean conditions where it matters most to the fishing industry (where fishing occurs) and bridges the gap between fisheries and science. FishSOOP supports sustainable ocean use, improves climate and ecosystem understanding, and empowers communities with open data. FFI: IMOS FishSOOP, UNSW FishSOOP
The FishSOOP dataset comprises a large number of closely spaced deployments of temperature sensors, unevenly distributed but mostly over the continental shelf and slope. To help you explore this dataset, we have produced a range of visualisations, as described below.
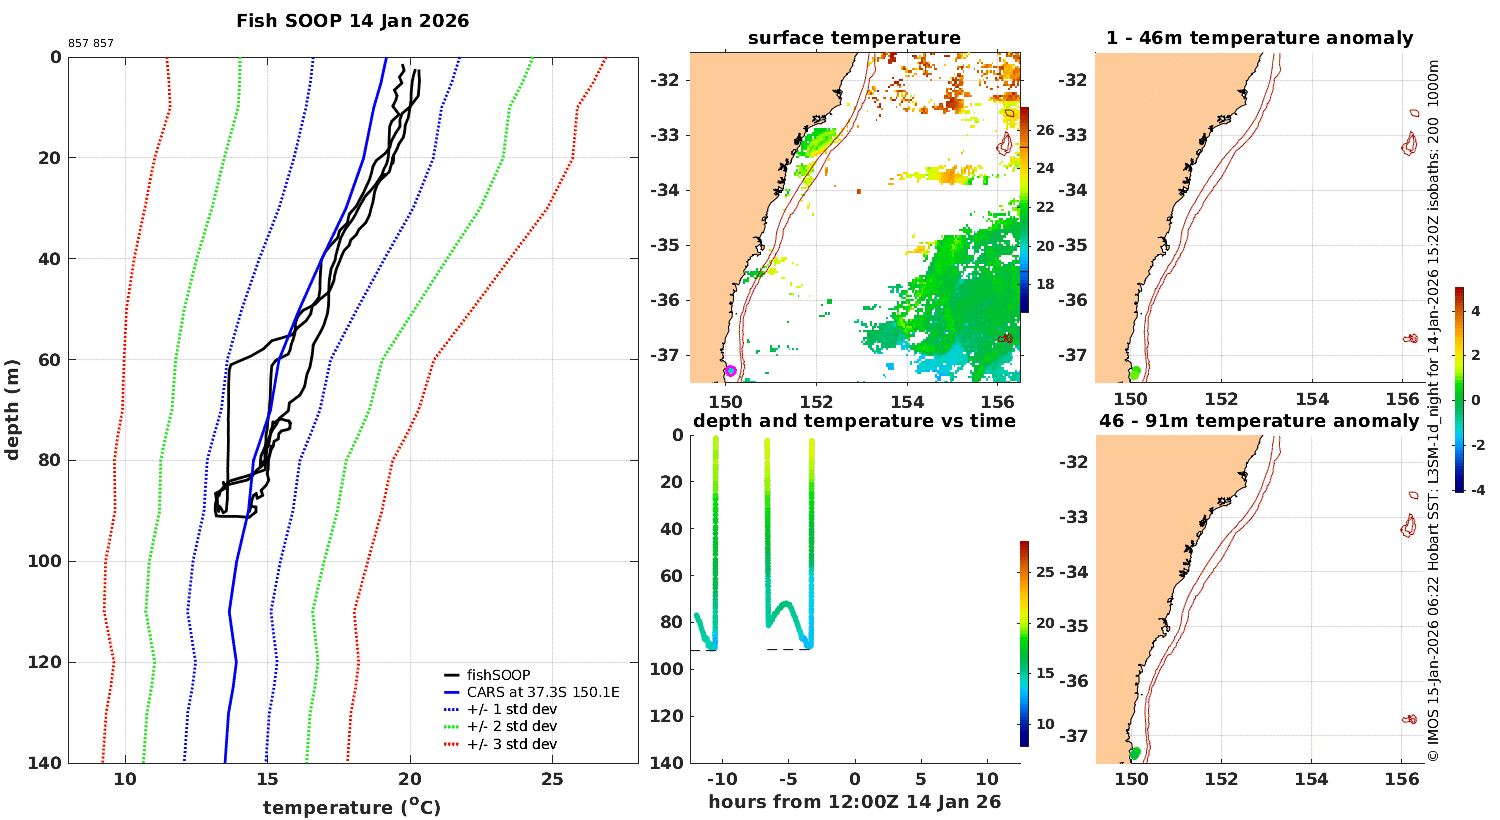
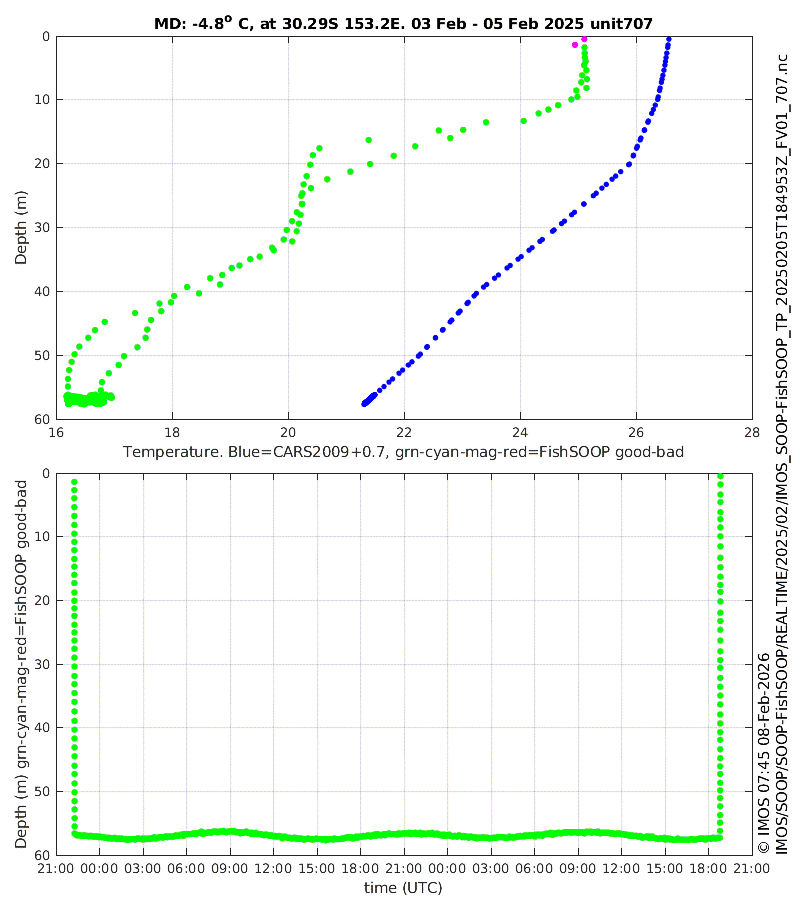
These pages have five panels, all of which show the FishSOOP temperature data during a 24h period, within one of 18 pre-determined regions around Australia. Showing multiple deployments at once greatly reduces the number of plots and allows quick intercomparison of nearby data. But occasionally, there is too much data for one plot, which is a good problem to have! Watch this space.
Left panel: The FishSOOP temperature observations are shown as black lines. To get a sense of how 'normal' these observations are, we include the climatological average profile (as a bold blue line) at the location of the deepest FishSOOP deployment, as well as the climatological average plus 1, 2 and 3 climatological standard deviations (as thin blue, green and red lines - see key). The climatology used is the CSIRO Atlas of Regional Seas (CARS 2009), which, importantly, is now quite old. See below for more on the issue of old vs recent observations in the context of global warming.
Centre panels, top, overlays the locations of FishSOOP data on a Sea Surface Temperature image. The colourbar for both SST and the FishSOOP 0-50m average temperature spans the CARS surface temperature range across the domain shown, plus [-2 2] °C (see two lines on the colour bar denoting the CARS range without buffer). Hover on the circled FishSOOP data to see the sensor 0-5m temperature, serial number, maximum depth reached and the water depth according to GEBCO_2019. Click to go to the AODN thredds server where you can download the data.
Centre panels, bottom, shows colour-coded FishSOOP temperature observations vs time and depth. FishSOOP temperature sensors are attached to a wide variety of fishing gear, some of which go to the sea floor for several days, while others go to mid-depth for a while. The FishSOOP data does not include the total water depth so we add the GEBCO_2019 estimate of this as a horizontal dashed line spanning the duration of the deployment. If this depth is beyond the axis limits it is written at the bottom of the panel.
Right panels, top and bottom, show the averages, within depth ranges defined by the top and bottom halves of the deepest deployment, of the anomaly of the FishSOOP observed temperature. These anomalies are with reference to the CARS temperature estimates at the individual deployment locations - not a single location for all (as used in the left panel).
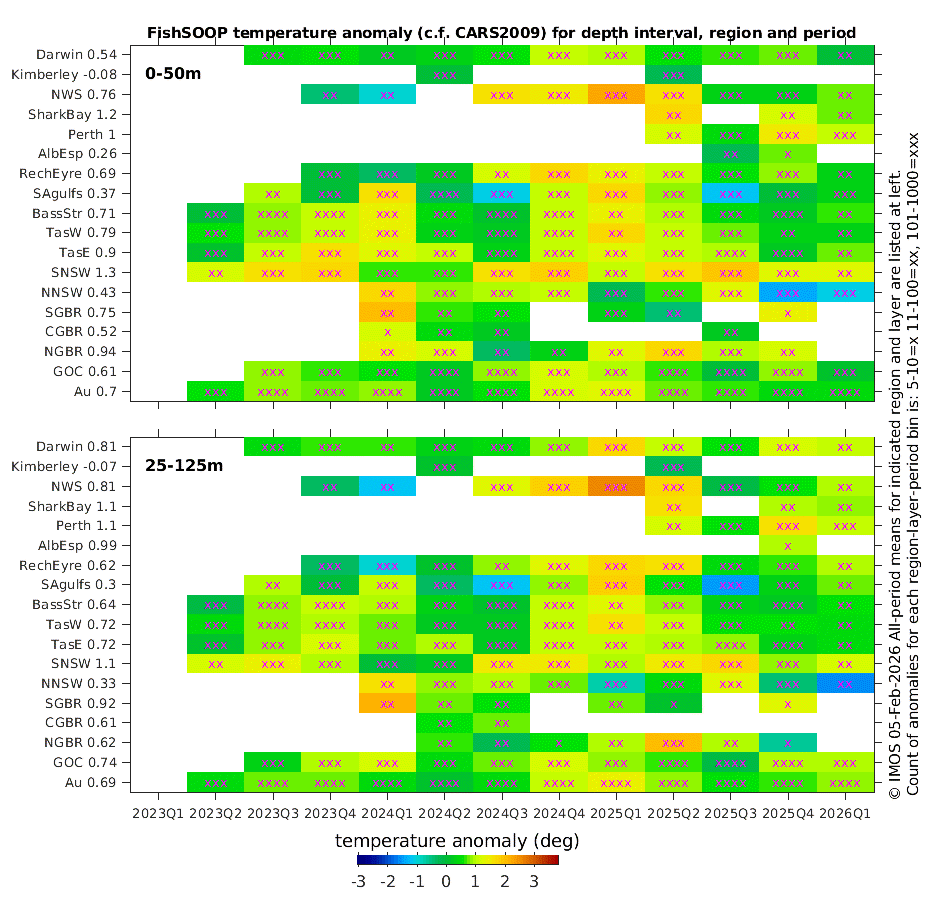
The plot above at left (click to expand) was initially conceived as a 1-page summary of the FishSOOP data coverage. It is now a 4-page summary (two depth zones, or layers, per page, see top left of each panel), showing also the 3-month average temperature difference (the anomaly) between FishSOOP data and CARS2009, and an indication (log10 number of x's) of the number of observations in each region-depth-time bin. Click through to see other layers.
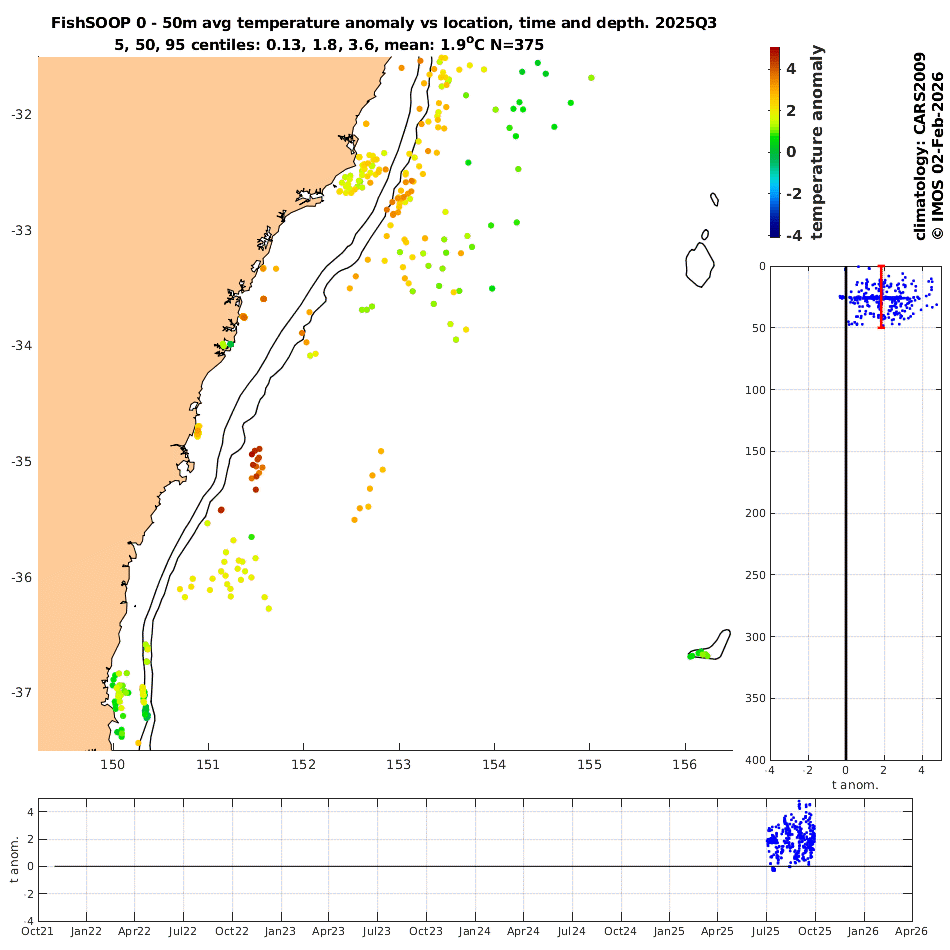
Significantly, there is nearly as much quasi-random variation of these 3-month averages as we saw in the daily data, as evidenced by the need to use a colourbar spanning -3 to +4°. This says that the anomalies have a characteristic duration well in excess of a day, and closer to a few months. At left next to the region name is the all-time average for that region and layer. (At the bottom of that list is the Australia-wide region.) These are not so random. More specifically, very few of these all-time averages are below zero, as we will discuss below. Also noteworthy is that the Southern NSW region is where the greatest all-time average difference from CARS was observed (rivalled by Shark Bay, but there are far fewer observations there). Looking along the time axis for the top 2 layers in SNSW, we see that 2025Q3 (July, Aug, Sep) was particularly warm. The plot at above right shows the data for the quarter. Remarkably, there were almost no negative anomalies observed in the single-deployment averages. This preponderance of positive anomalies indicates that the local scale variation of the anomalies is less than the regional scale anomaly, which was 1.9°. In principal, it could also mean that FishSOOP sample locations are very non-randomly placed (strongly favouring warm water).
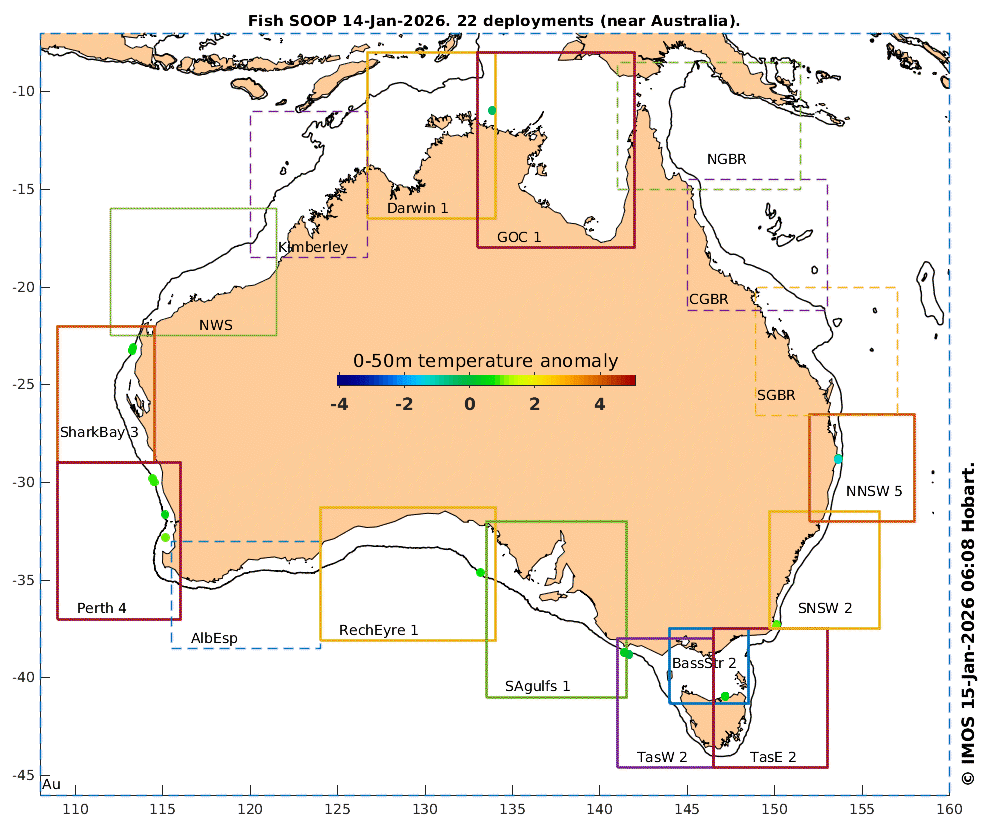
The plot above is the Australia-wide summary, but there are also plots for 17 regions reachable by links. For each region, the average difference between the FishSOOP observations and climatology (the 'anomaly') is shown for 8 overlapping layers, one of which is the whole water-column (nominally 0-1000m), shown above (at half size, click to expand).
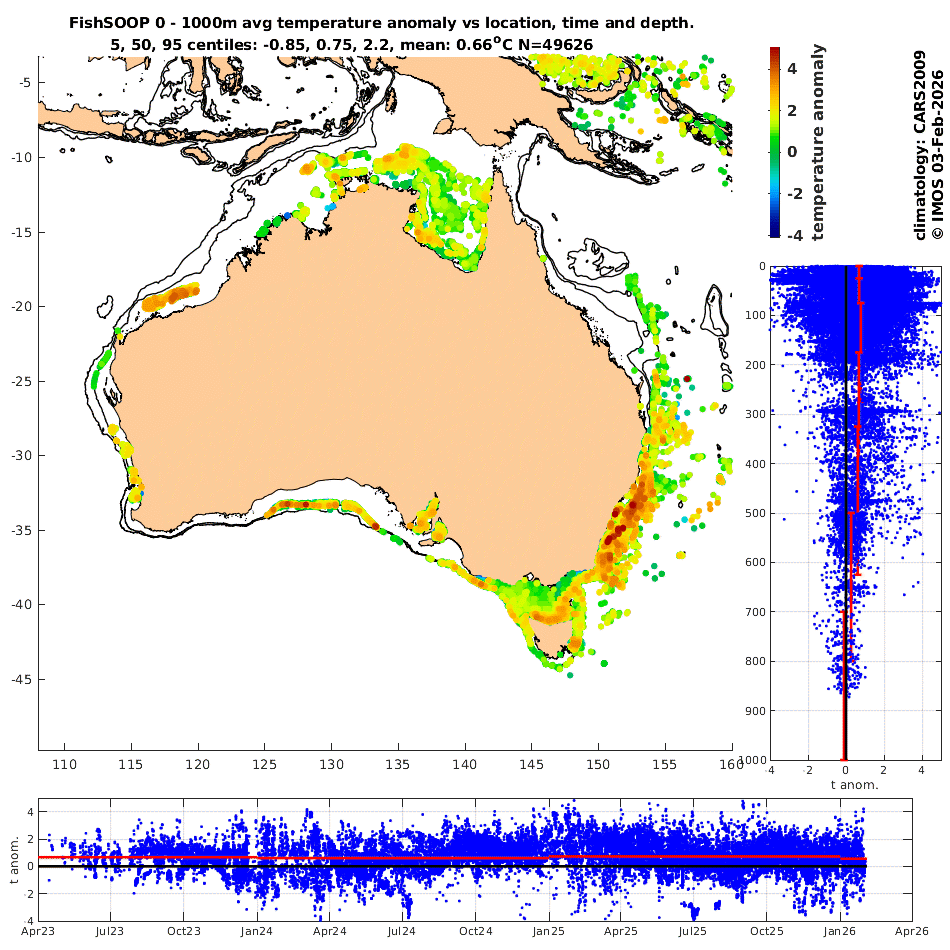
Panel 1 Each dot on the map represents a single deployment of a FishSOOP sensor. Its location is the average for the deployment, while the colour represents the layer-average anomaly - the average of all measurements taken within a certain depth range. A few notes: 1) at this point we are treating short deployments the same as long ones (e.g. we have not calculated duration-weighted mean anomalies), 2) some deployments are obscured on the map because there are so many, so use the regional plots to see more individual deployments.
The title of the plot lists some statistics of the anomalies; the 5th, 50th and 95th centile values and the mean. These tell us that on 2 Feb 2026, the FishSOOP data set comprised 49626 deployments in the Australian region. For the coldest (relative to historical data interpolated to location and day-of-year) 5% of these, the depth-averaged temperature was lower than climatology by 0.85°C. Conversely, for the warmest 5% (the 95th centile), the depth-averaged anomaly was higher than climatology by 2.2°C. The median (50th centile) anomaly was 0.75° while the mean anomaly was 0.66°. The day to day variations are large (hence the need for a colourbar spanning -4 to +5°), but the mean is clearly non-zero.
Panel 2 Each dot represents a layer-mean anomaly from one deployment. It is plotted at the mean depth of all the data points within a depth-window (or 'layer'). So a deployment that went to 1000m and back at a uniform speed will be plotted at 500m. A deployment that spent most of the time at a fixed depth is plotted at that depth. The average (over all regions and all time) of the layer-average temperature anomalies is shown by the horizonal position of the red line. The vertical extent of these red lines shows the depth-window of the layers, which overlap. The significance of the step change at 500m of this red line is discussed below.
Panel 3 shows the temporal variability of the anomalies, with annual averages (red lines) overlain on the individual observations. Note that for almost all regions (in years with more than just a few profiles), for depth-layers above 700m, none of the annual-averaged anomalies are negative, suggesting that the FishSOOP observations are systematicly warmer, on average, than co-located CARS2009 counterparts.
Discussion and Conclusion The CARS2009 climatology is based on ocean observations made exclusively before about 2008, so it can be thought of as representing the observed ocean state from two to several decades ago. If we interpret the mean anomaly of the FishSOOP observations (0.7°) as being due to a change over 4 decades, the average rate of change is 0.17°/decade. This is consistent with many published estimates of the average rate of temperature change in the upper ocean. The lack of strong vertical gradient (down to about 500m) of the FishSOOP anomalies is also consistent with the findings of Roemich et al. (2015) who analysed Argo data. We therefore conclude that the average size of the FishSOOP differences from the CARS climatology are consistent with independent estimates of how much the oceans have warmed in recent decades, suggesting that the observed difference is not an artefact of some sort. Importantly, the FishSOOP observations fill a gap between the blue-water coverage of Argo and coastal ocean sampling, pointing to an absence of some process that might cause a systematic difference between coastal and deep-ocean temperatures.
In contrast to the previous section focussing on the temporal- and spatial-averages of anomalies, here we focus on extreme cases of single-deployment (but depth-averaged) anomalies, starting with the greatest (absolute) difference from CARS2009. For these plots we take the age of CARS2009, adding a uniform value of 0.7° to it, as determined above).
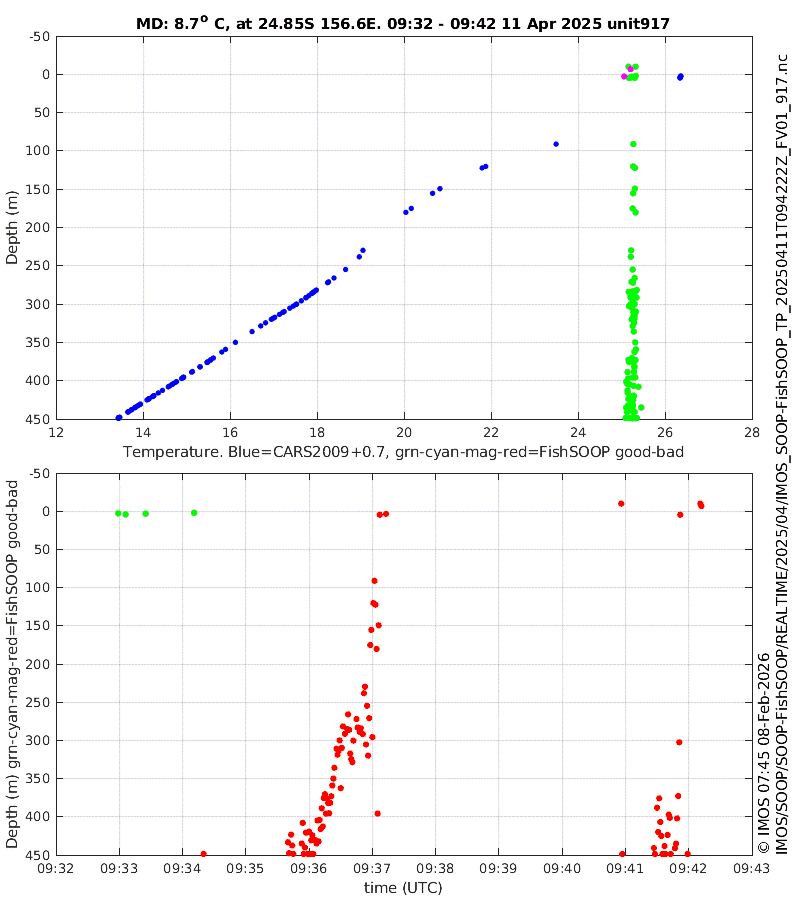
The most-extreme FishSOOP temperature anomaly was on 11 April 2025 at 24.8°S 156.6°E (see above). According to sensor 917, the temperature was about 25° from surface to bottom. This agrees with CARS (age corrected as mentioned) at the surface but differs by about 12° at 450m, giving an average from surface to 450m of 8.7°. At 450m, an anomaly of 12° is about 14 standard deviations from climatology (see the daily plot for SGBR), so the chance of this observation being correct would seem to be negligible. But could the sensor have sampled a really extreme warm-core eddy? We don't think so: the snapshot SST+altimetry SGBR image for the day shows a cyclonic (cold core) eddy in the vicinity, not a warm-core one. Could a tuna or a shark be involved? We don't know. Explanations aside, the lower panel of the plot above shows that the FishSOOP facility's QC procedures flagged the depth data as bad (denoted here by the dots being red), but the temperatures were still flagged good (something that tricked some of our plotting scripts; we will remake the plots at some point). The lesson here is that users need to check both quality flags.
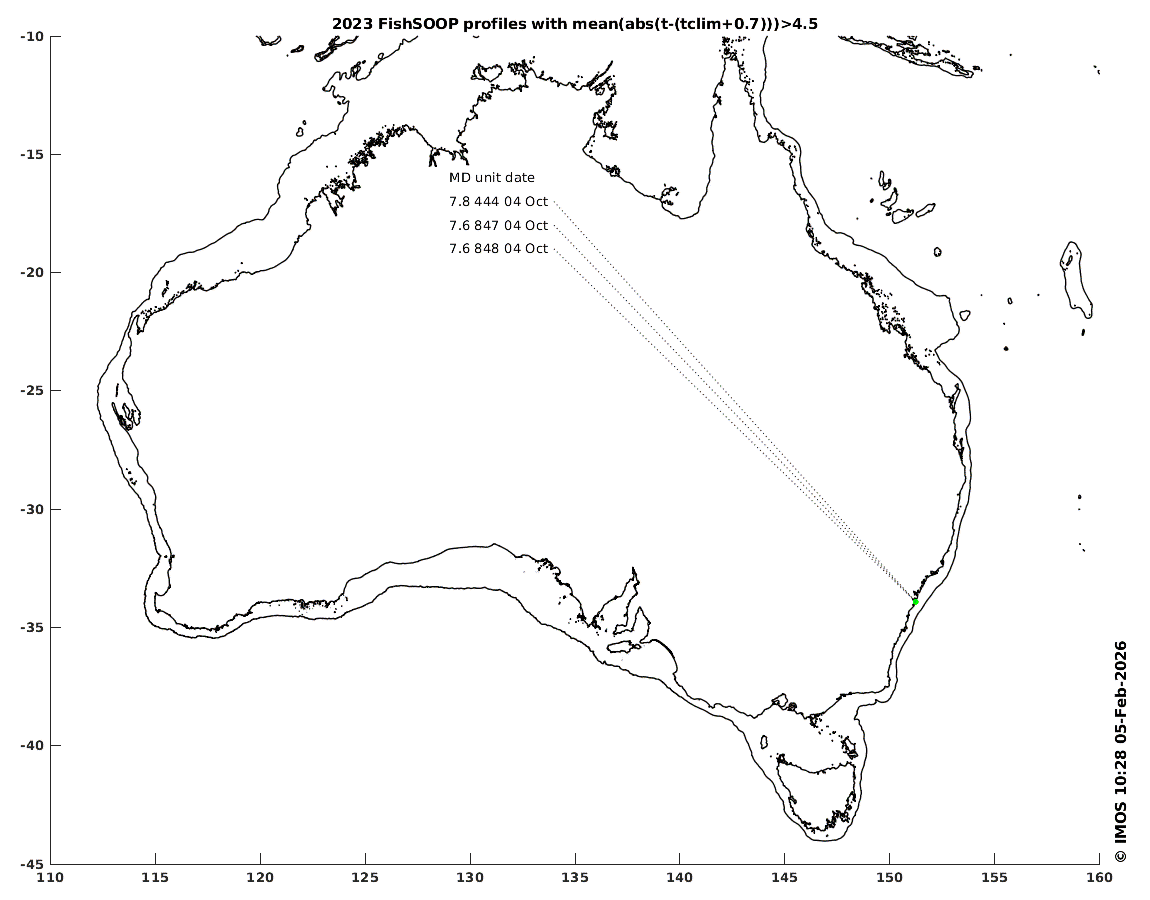
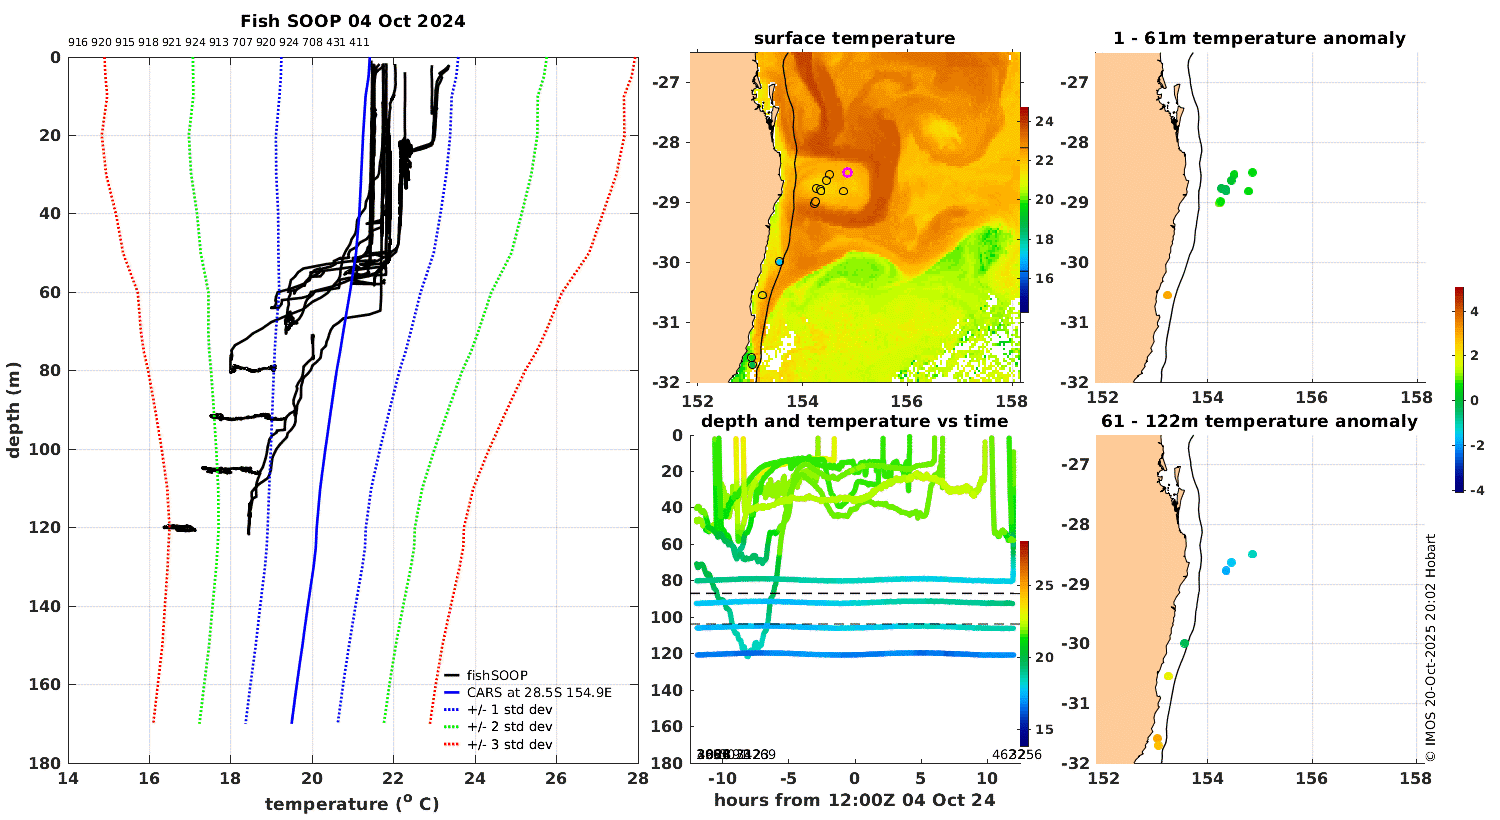
Next in the ranking come three FishSOOP deployments on 4 October 2023 with depth-averaged anomalies of 7.6 to 7.8° (averaged from surface to 15m). But these occurred at 33.917°S 151.235°E, which is on land. Some testing data has apparently slipped through the QC procedures, reminding us that automated quality control algorithms as well as expert assessors inevitably make mistakes deciding if extremes in the data are genuine, due the instrumental error, or human/context error.
The 16 next-biggest single-deployment depth-averaged anomalies in the FishSOOP data set are all below 4.8° (either positive or negative) and appear to us to be genuine.
In 2024, there were two cold anomalies near Eden (37°S) on 20 March 2024 (also seen in SST imagery) and three cold anomalies near Coffs Harbour (30°S) from 29 November to 2 December (also seen in SST imagery. One of the Coffs Harbour deployments is interesting in that the anomaly is near zero at the surface, but reached about -6° at 120m (the bottom, where it sampled for 3 days, see the temperature minimum of 12°). The IMOS ADCP off Coffs in 100m of water 'CH100' also measured a very low near-bottom temperature (about 12°) from 27 Nov to 4 Dec, corroborating the FishSOOP observation.
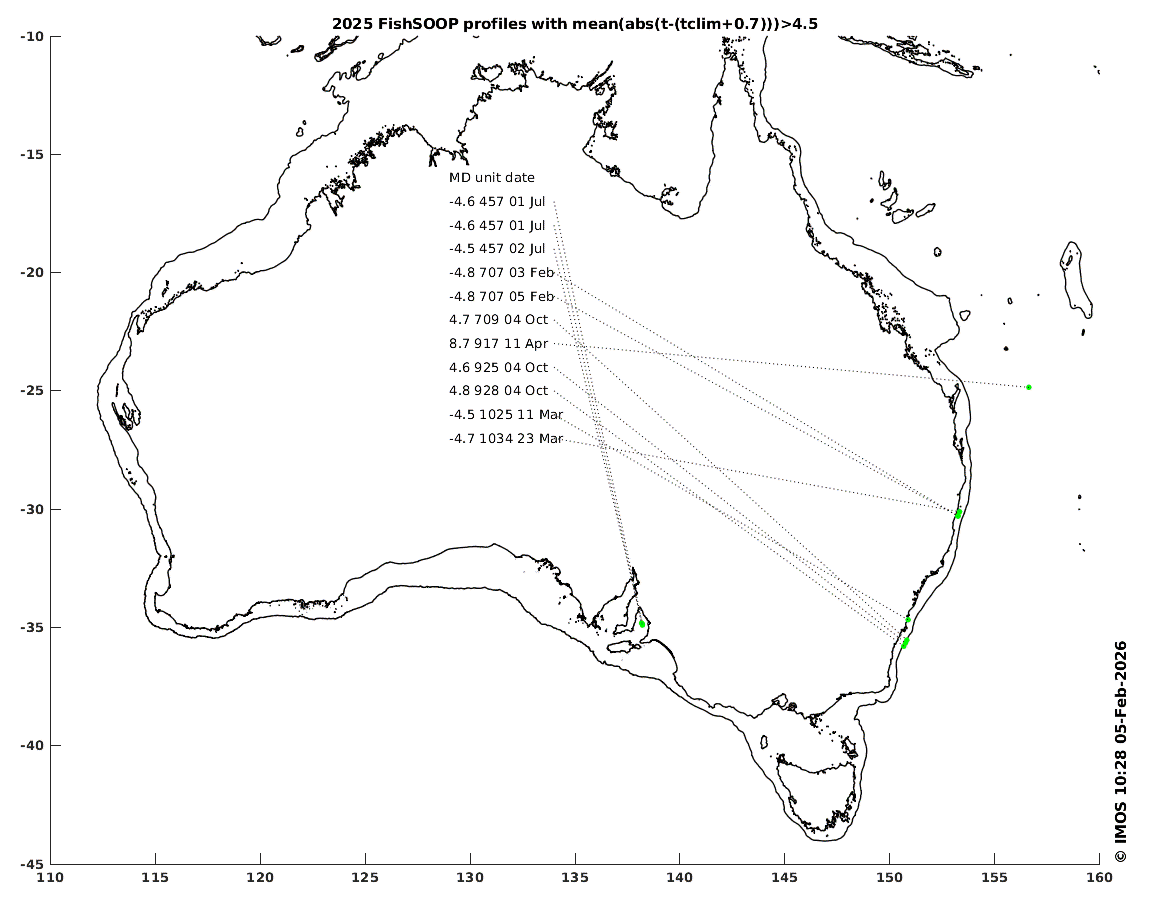
2025 had 10 strong anomalies, 7 cold across 3 locations and 3 warm at one location (see above left). The (1-2 July) St Vincent Gulf cold anomalies were uniform with depth to the bottom at 30m. The 5-8 Feb Coffs Harbour cold anomalies were strongest near-bottom (above right, like in 2024) and (as often seen on the NSW coastline) coincident with strong nearby southward flow of the East Australian Current (see SST image. The 4 Oct Batemans Bay warm anomalies sampled to about 40m in EAC waters off the continental shelf (see this SST image).
As of 10 Feb 2026, there has only been 1 depth-averaged absolute anomaly greater than 4.5° this year. This was on 23 January off the NSW Central Coast in EAC waters, where the temperature was 26.2° from surface to 70m (where CARS says there would normally be a strong thermocline). See also nearby profiles.
| Cold-core eddy off Byron Bay Cold core eddies are not always very cold at the surface. Oceanographers are more likely to infer their presence from seeing water circulating in a clockwise direction in an SST image (see top middle panel), or a depression of the sea level in satellite-based observations. The FishSOOP subsurface (60-120m) temperature anomalies in the centre of this eddy off northern NSW are about -2°C (see bottom right panel), signaling an uplift of the isotherms by about 40m (see slope of blue line in left panel). The deep temperature minimum of 18.5 ° is about 1.5 standard deviations colder than the climatological mean, suggesting that this is a moderately strong eddy. |
 |
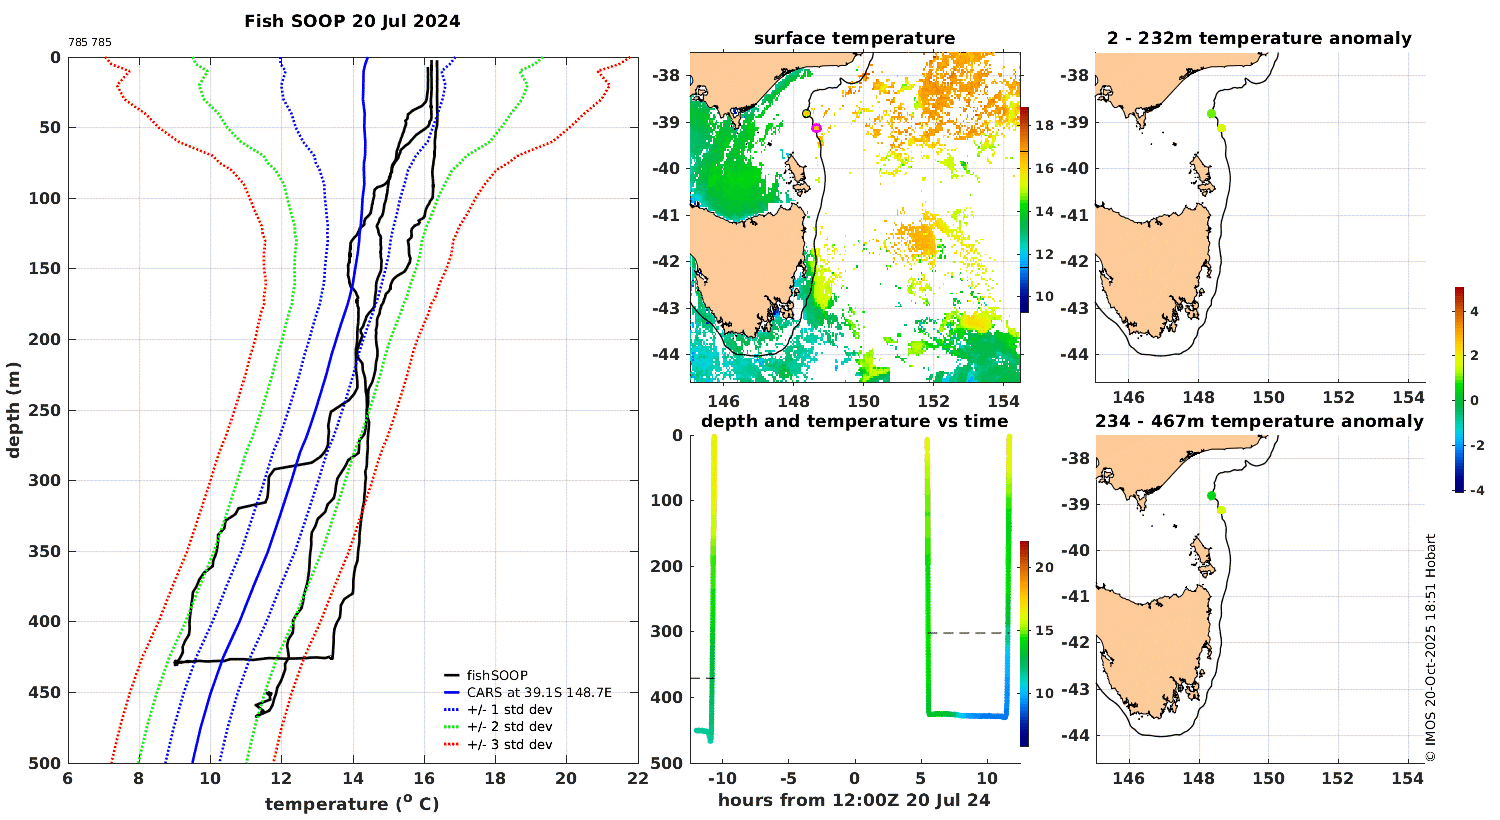
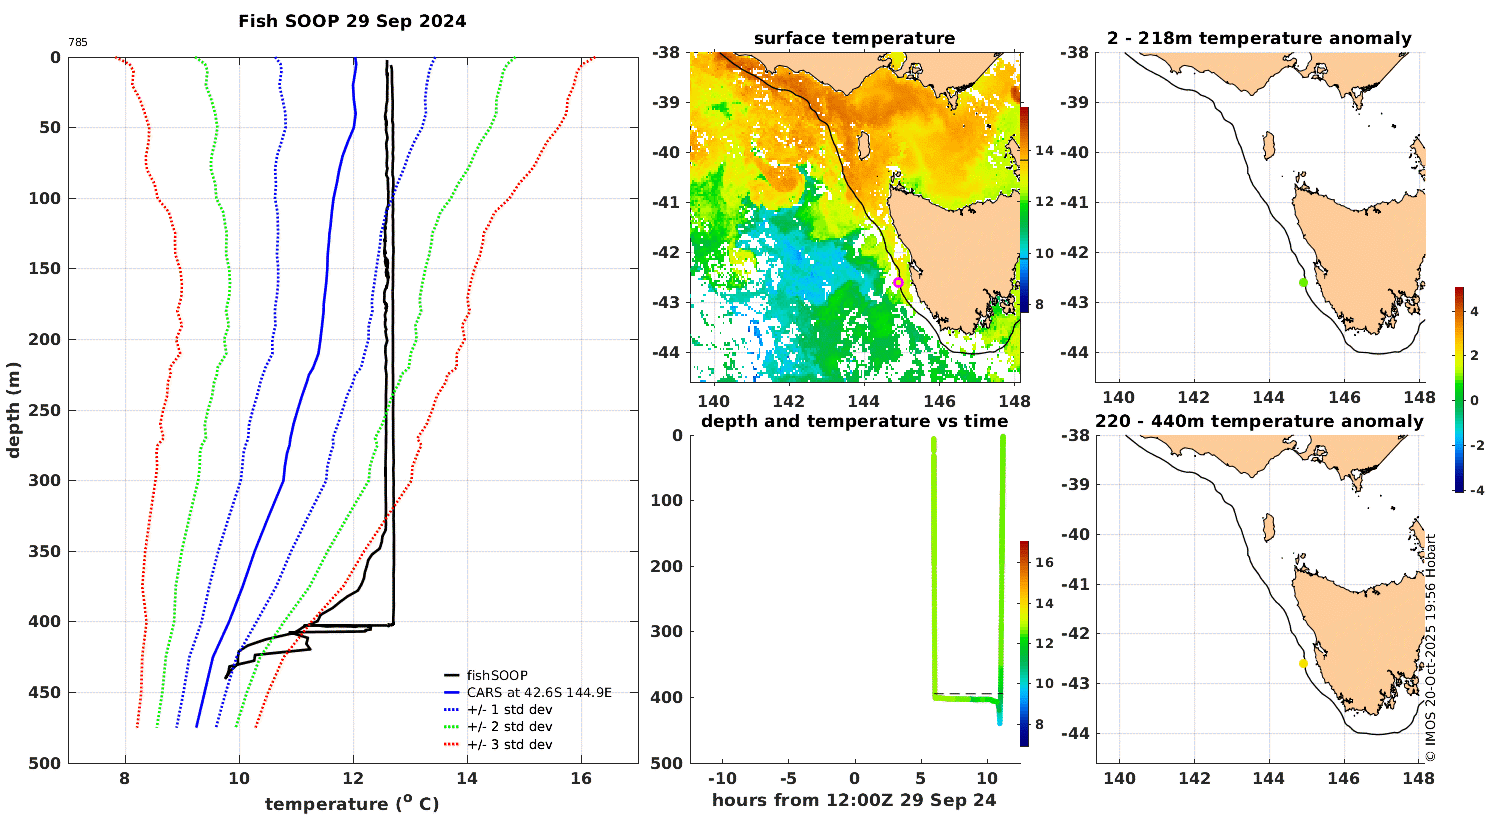
| Bass Strait Winter Cascade or Tasman Sea water? In July 2024, sensor 785 was deployed several times to about 430m at the upper continental slope off eastern Bass Strait. It was retrieved each time within about 7h. The deployment and retrieval temperature profiles were mostly similar but on both 20 July and 30 July, a difference of about 4 ° between the downward and upward measurements was recorded between 330m and 430m. What could have caused such big changes? One potential explanation is that the retrieval encountered some Bass Strait Winter Cascade water, but the deployment did not. Indeed, the SST images show that the surface water in Bass Strait was much colder (about 13 °) than the water off the shelf, so some of this cold (and therefore dense) water might have been falling off the shelf like an underwater waterfall. But why the change over just a few hours? The sensor depth was constant (see left and centre bottom panels), suggesting it was stationary on the bottom, and therefore that the path taken by, or the strength of, the Cascade was varying with time, perhaps due to the tide. Alternatively, maybe the cold water came from below rather than from above. The cold water sampled by sensor 785 was just 9 °C, somewhat colder than we expect to find in Bass Strait water. See this July 2021 glider mission, for example which found the water to be about 12.5 °C at all depths in the central basin. Where do we expect to find 9 ° water? An Argo profile on 12 July 2024 found it at about 500m in deep water east of Flinders Island, suggesting that what sensor 785 found was Tasman Sea water, temporarily upwelled at the continental slope, perhaps by an internal tide. Regardless of the cause, it is worth noting that this was such a large-amplitude event that some of the data (the warmest at depth) would have been flagged as bad if values outside 3 standard deviations from climatology were rejected. |
 |
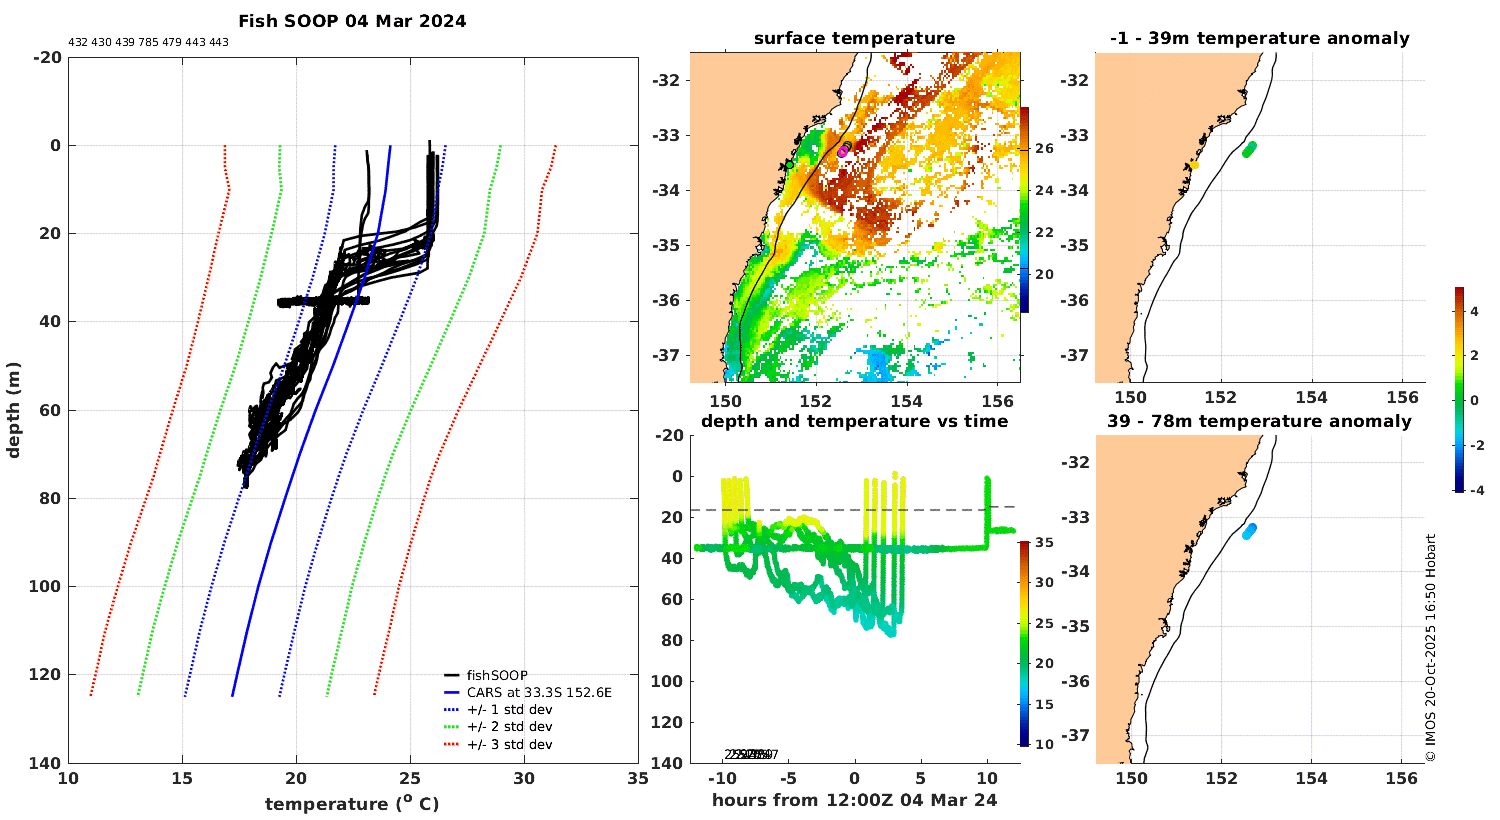
| Swarm deployment of five sensors It is not that often that oceanographers deploy five sensors over 3h and 20km. But that's what this fisher did in deep water off Stockton Bight on 4 March 2024. The SST image suggests that these deployments were into the warm waters of the East Australian Current. But the sensors tell a different story. The surface waters were indeed warm (26 °C, 1 standard deviation above climatology) but this was just a very thin layer, just 10 to 20m thick. Beneath that warm water was water about 4 ° colder, which was what a sensor at the coast was finding from surface to 35m. This is not really surprising, but is interesting to see so clearly. |
 |
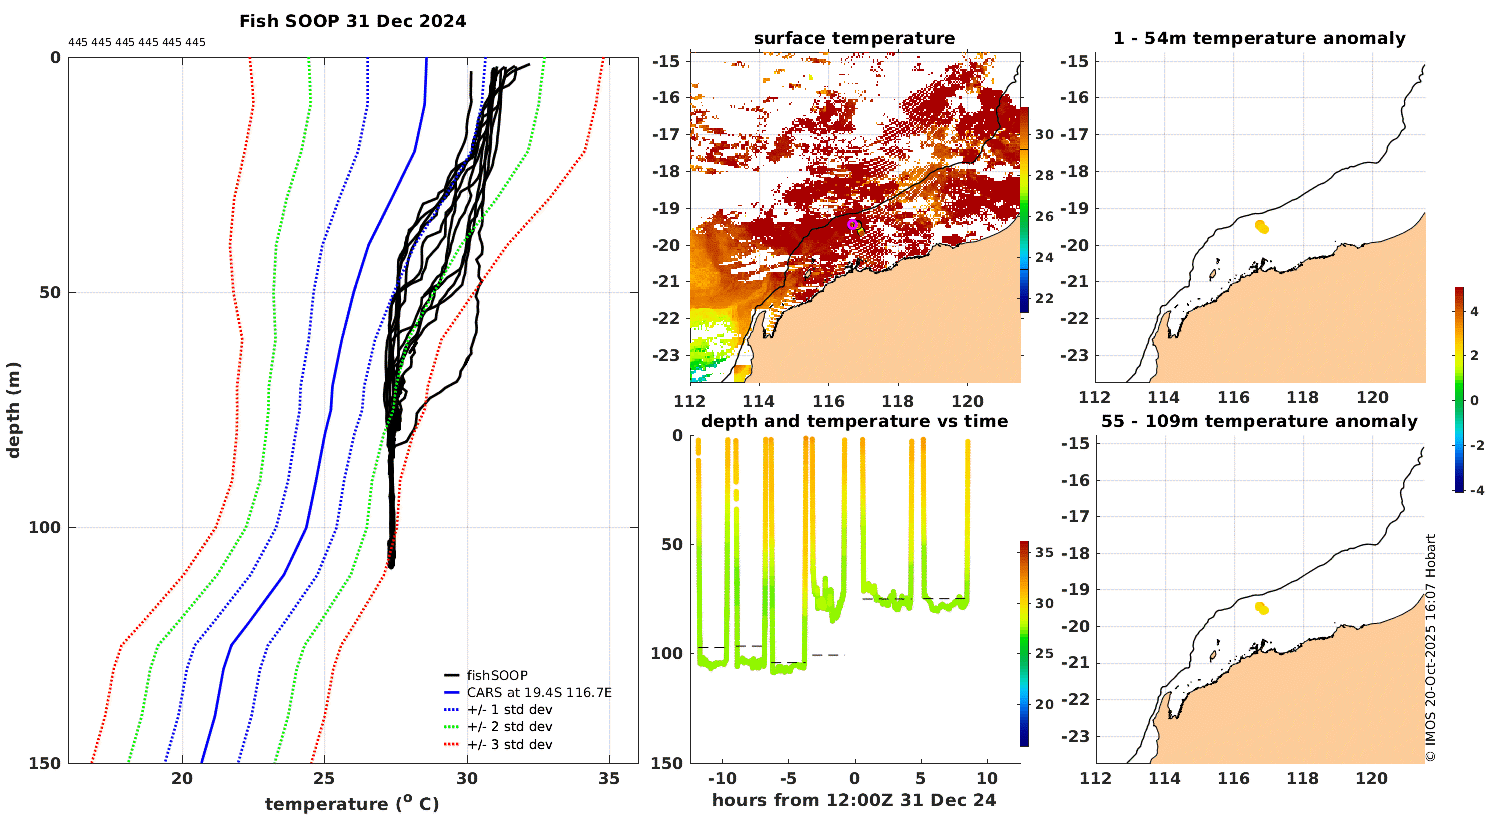
| Internal tides on the North West Shelf Sensor 445 was busy on 31 Dec 2024 documenting some large-amplitude internal tides north of Dampier on the North West Shelf. Six deploments to 70 to 100m were made over 24h, spanning a distance of about 20km. All recorded a surface temperature close to 31 °C and a bottom temperature of 27.5 °C. Where they differed was in the depth of the 29 ° isotherm, which varied from about 75m to 30m. The intervals between maxima and between minima are both about 12h, confirming that these are internal tides, which is what this region is known for in summer when shelf waters are stratified. |
 |
| South Australian algal bloom South Australia suffered a major Harmful Algal Bloom (HAB)that is thought to be due, at least in part, to a marine heatwave (MHW) that started around September 2024. Sensor 786 was deployed many times during the MHW, but mostly near the shelf edge off the Bonney Coast, between Portland and Robe, where it monitored the temperature of the South Australian Current. The 10 September 2024 deployment of sensor 786 found that water temperatures of the SAC were 2 to 5 degrees warmer than climatology, and below 300m, well in excess of climatology plus 3 standard deviations. It is hard to believe that this strong flow of warm water did not set the stage somehow (perhaps by suppressing the usual summer upwelling) for the waters near the Fleurieu Peninsula to become very hot in March 2025 when the HAB began. These observations by sensors 786 (and 421, which sampled inshore) are sure to be of value as oceanographers continue to learn more about the causes of this extreme event. |
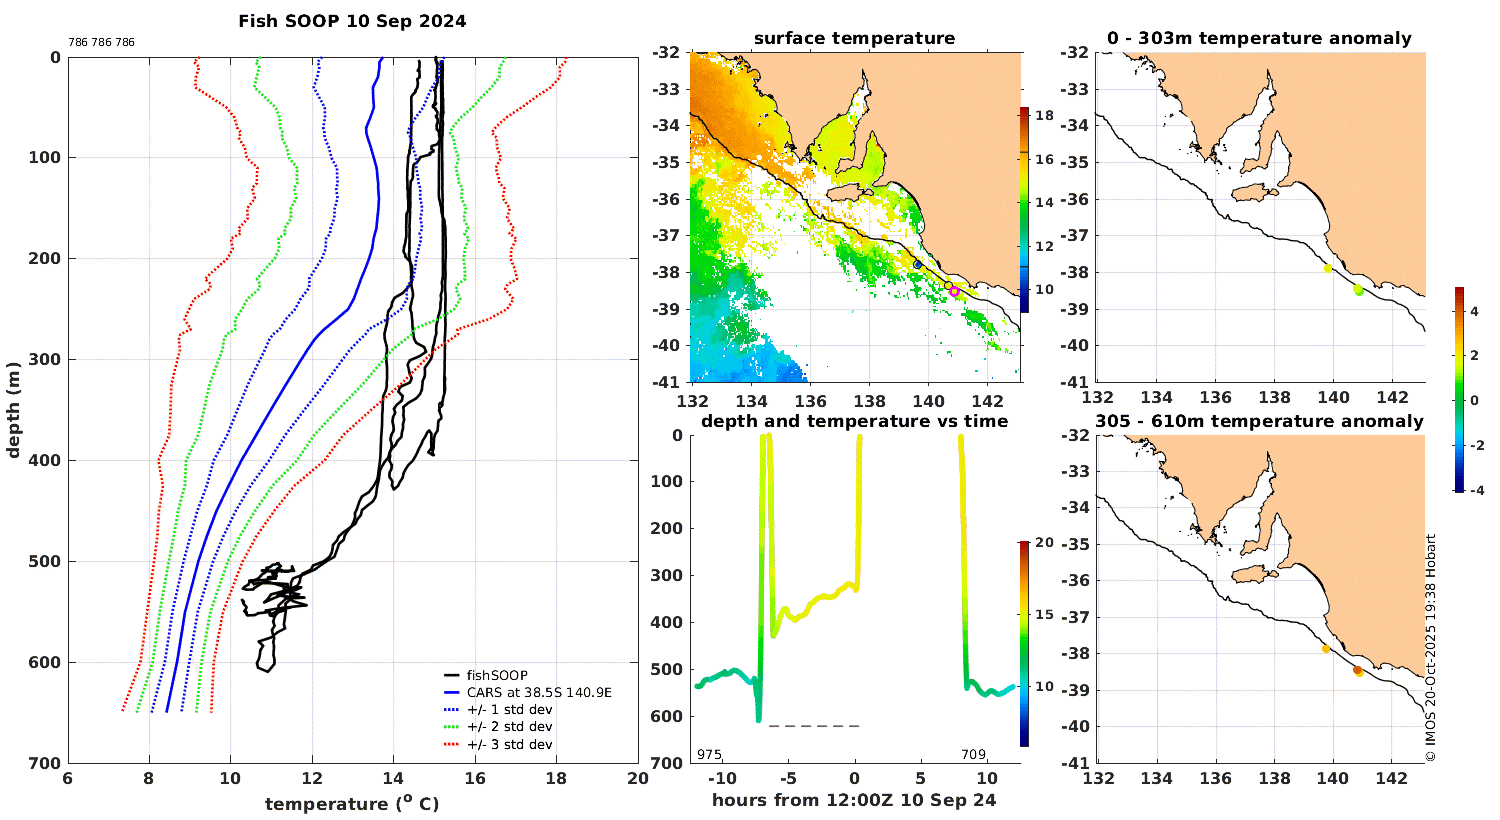 |
| The South Australian Current off Tasmania Much of the South Australian Current continues beyond the border with Victoria along the shelf edge west of Bass Strait then along the Tasmanian shelf edge where it is sometimes referred to as the Zeehan Current. Did the strong SAC observed by sensor 786 off the Bonney Coast (described above) show up off Tasmania as a strong Zeehan Current? Yes, according to sensor 785's measurements on 10 September 2024 at the shelf edge off Macquarie Harbour, which found near-normal temperature at the surface, but an anomaly of +3 ° at 400m, well outside of climatology plus 3 standard deviations. Notably, the temperature is completely isothermal from 0 to 400m. |
 |
| Cold water near bottom at 90m off Tiwi Island From 20 May to 2 July 2024, several FishSOOP sensors recorded the presence of a very cold layer of water in the bottom 10m over the outer continental shelf. This water was up to 7 °C colder (just outside 3 standard deviations) than the overlying water which was 29 °C (slightly warmer than climatology). The location of these observations was in 90m of water, NNE of Tiwi Island, not far from where IMOS has maintained a current meter mooring (NWSLYN, in 195m of water) since 2019. In June 2024, when FishSOOP recorded the cold layer, NWSLYN recorded temperatures of 16 ° to 18 ° at 154m as well as tidal period current velocities of about 0.2m/s in antiphase above and below 100m. These very different observing systems are therefore consistent and the picture that emerges is that internal tides are energetic at the NWSLYN site in June 2024 because the site is deep enough that the thermocline is near mid-depth. The FishSOOP observations, however, are in shallower water. Is the cold layer running up the slope like a wave coming onto a beach? Another question remaining is "why are the deep temperatures so much (about 10 °C) colder than those recorded by the ITFMHB mooring in a similar depth 250km to the WSW?" |
 |
Technical details of the FishSOOP program are documented by Lago, V., M. Roughan and S. Caon. (2025) IMOS Fishing Vessels as Ships of Opportunity (FishSOOP), Real-time Quality Assurance and Quality Control Practice Manual, Version 1.0. Integrated Marine Observing System. doi.org/10.26198/sp0r-p448. Possibly the most important detail documented in that report is that FishSOOP sensors are very accurate (0.05°C) and have a fairly fast response time (1s).
OceanCurrent does not perform any additional editing of the data set that is available at the IMOS data server. We show all data that are flagged as good (flag value 1) in the FV001. Data flagged otherwise (including 2='potentially correctable') are not shown (they are not many).
Stay in the loop! Subscribe to the FishSOOP newsletter
At the time of writing (Feb 2026) we think that the FishSOOP facility's QC procedures have only failed to flag bad data on three occasions (when instruments were being tested before deployment). But we also think that there are cases of good data being flagged as bad. Automatic QC is difficult! See if you agree with these: Deployments with a substantial number of observations flagged other than 'good'.
20 October 2025: First exposure draft
17 December 2025: News item announcing public access
January 2026: Annual and quarterly-averages added
16 February 2026: Notes section substantially added-to and edited
To Do