OceanCurrent - current meters
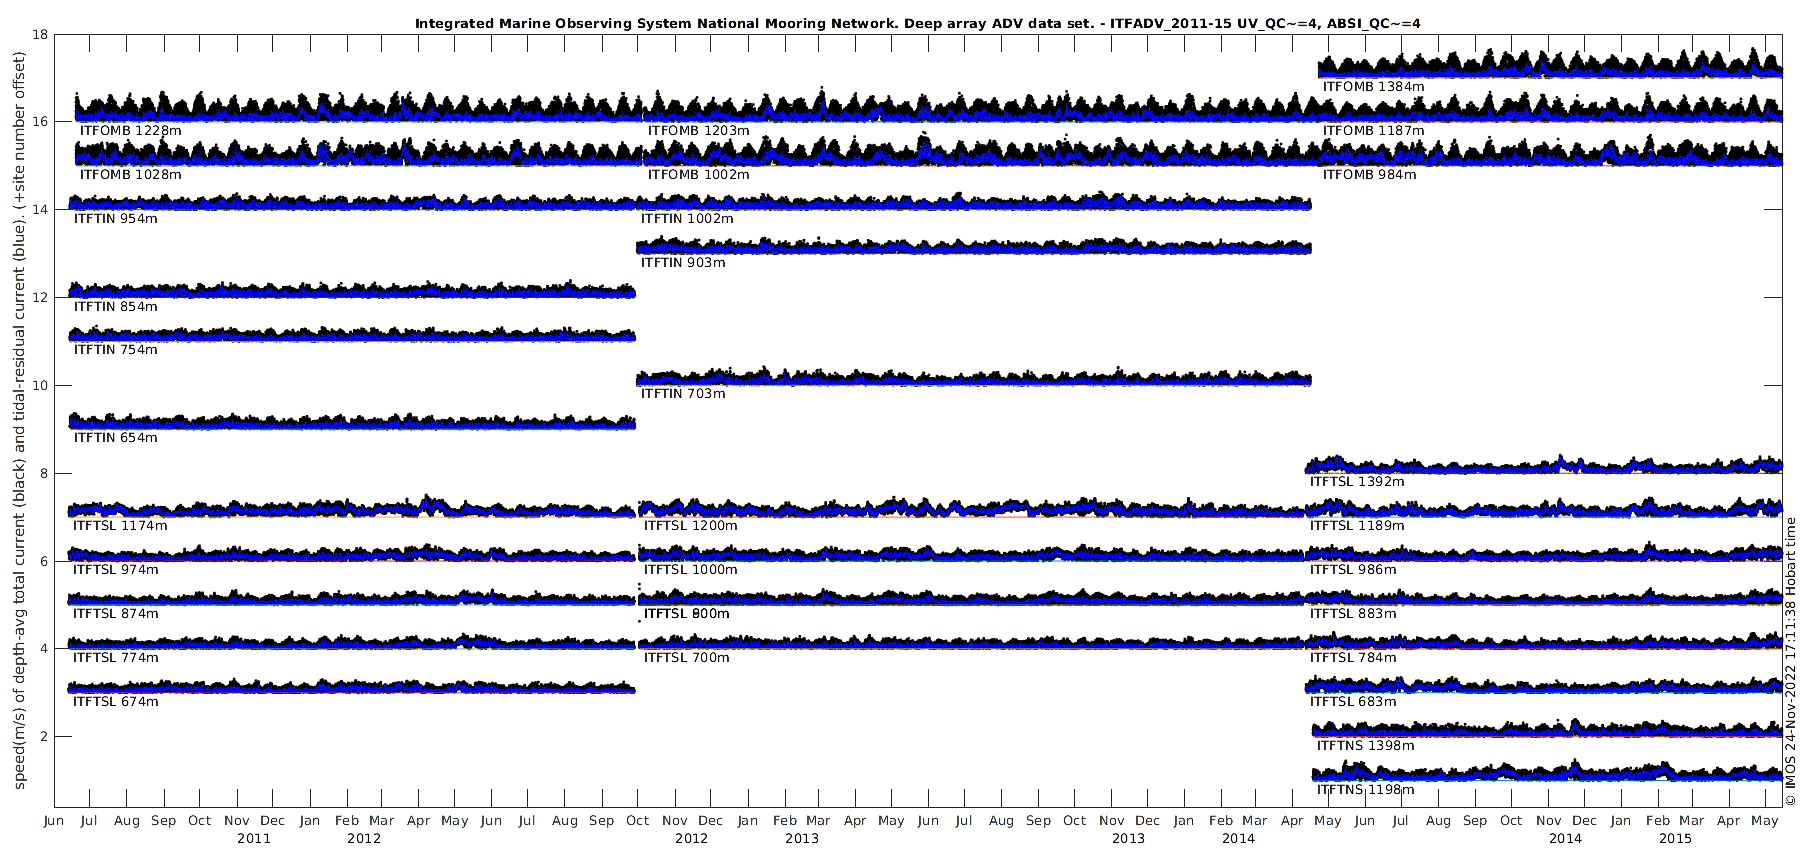
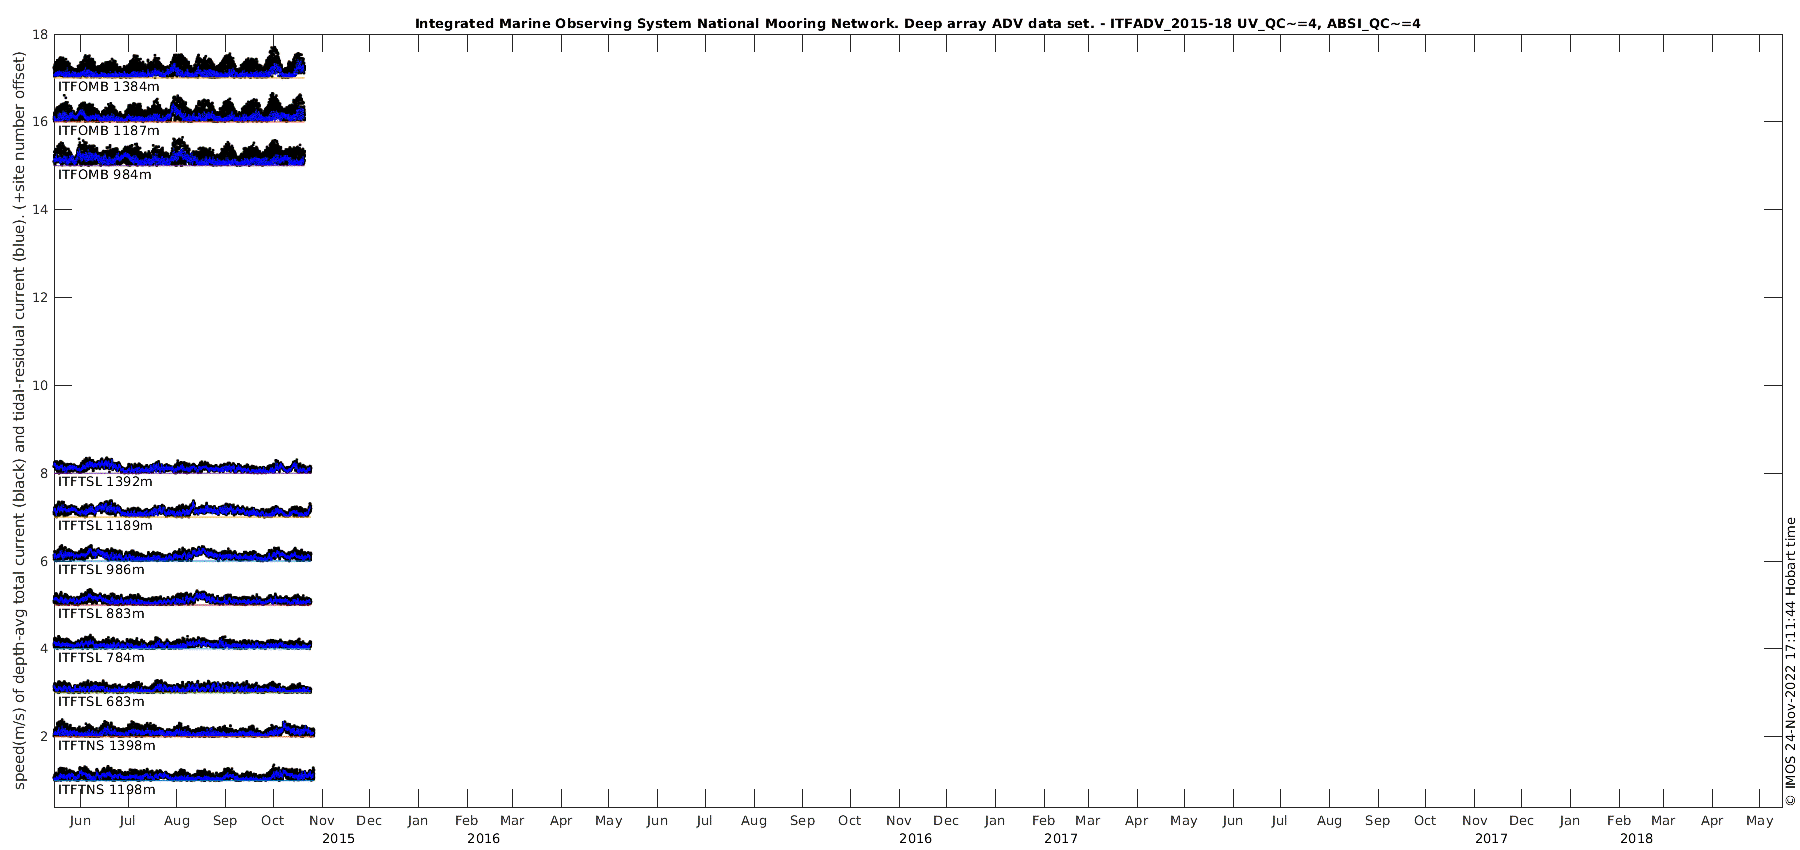
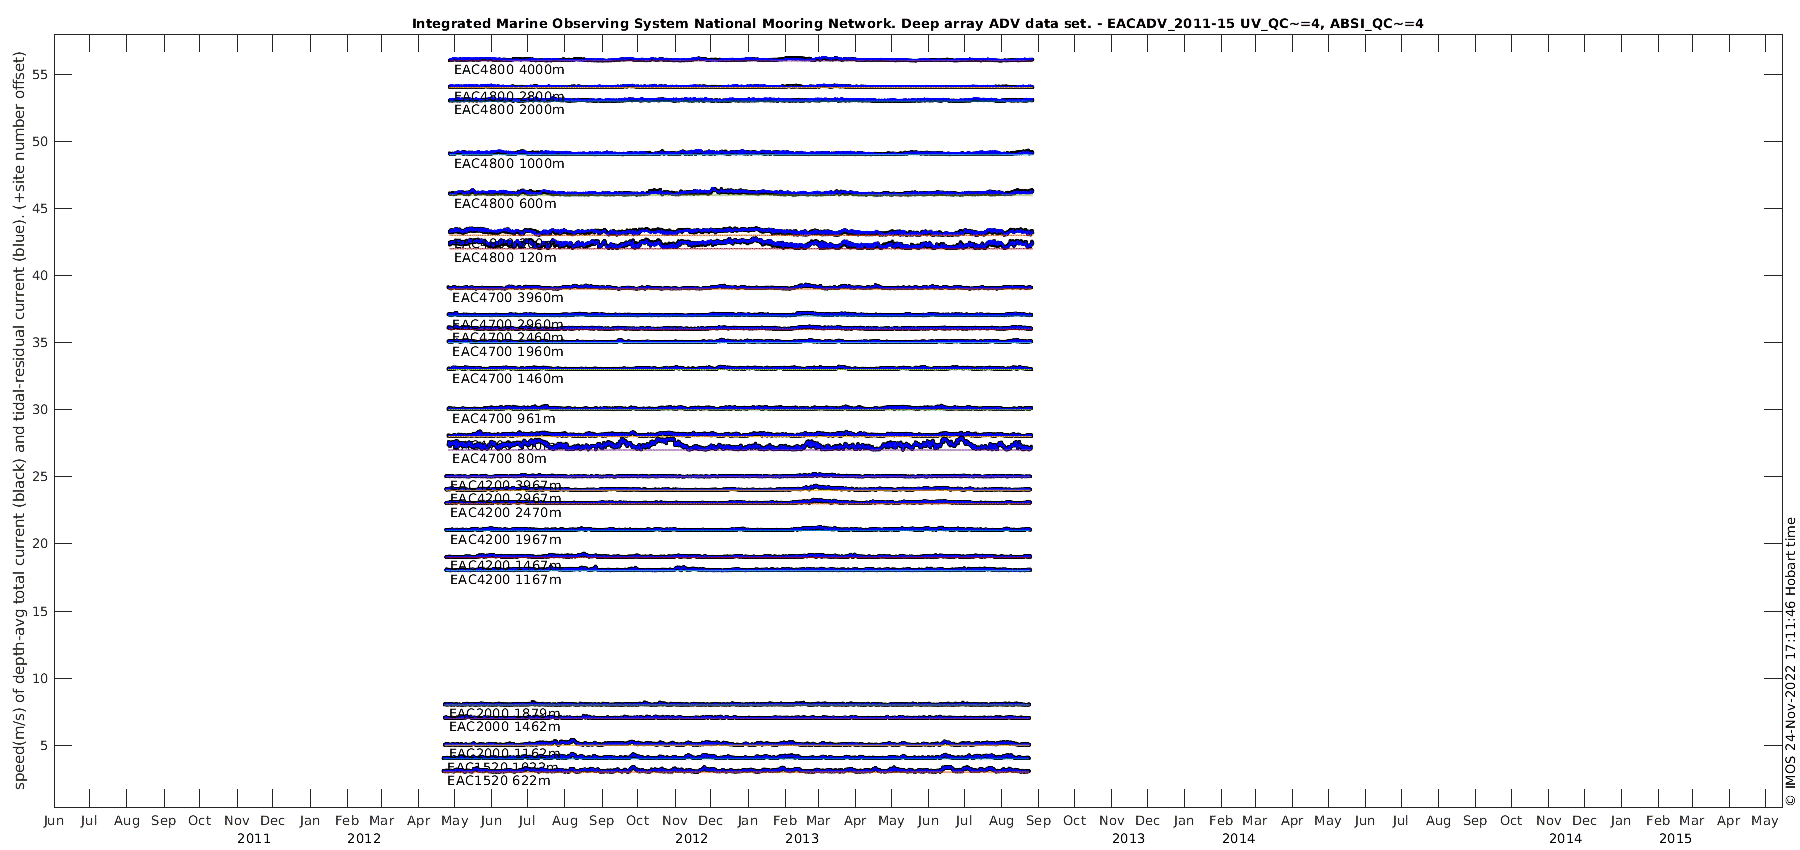
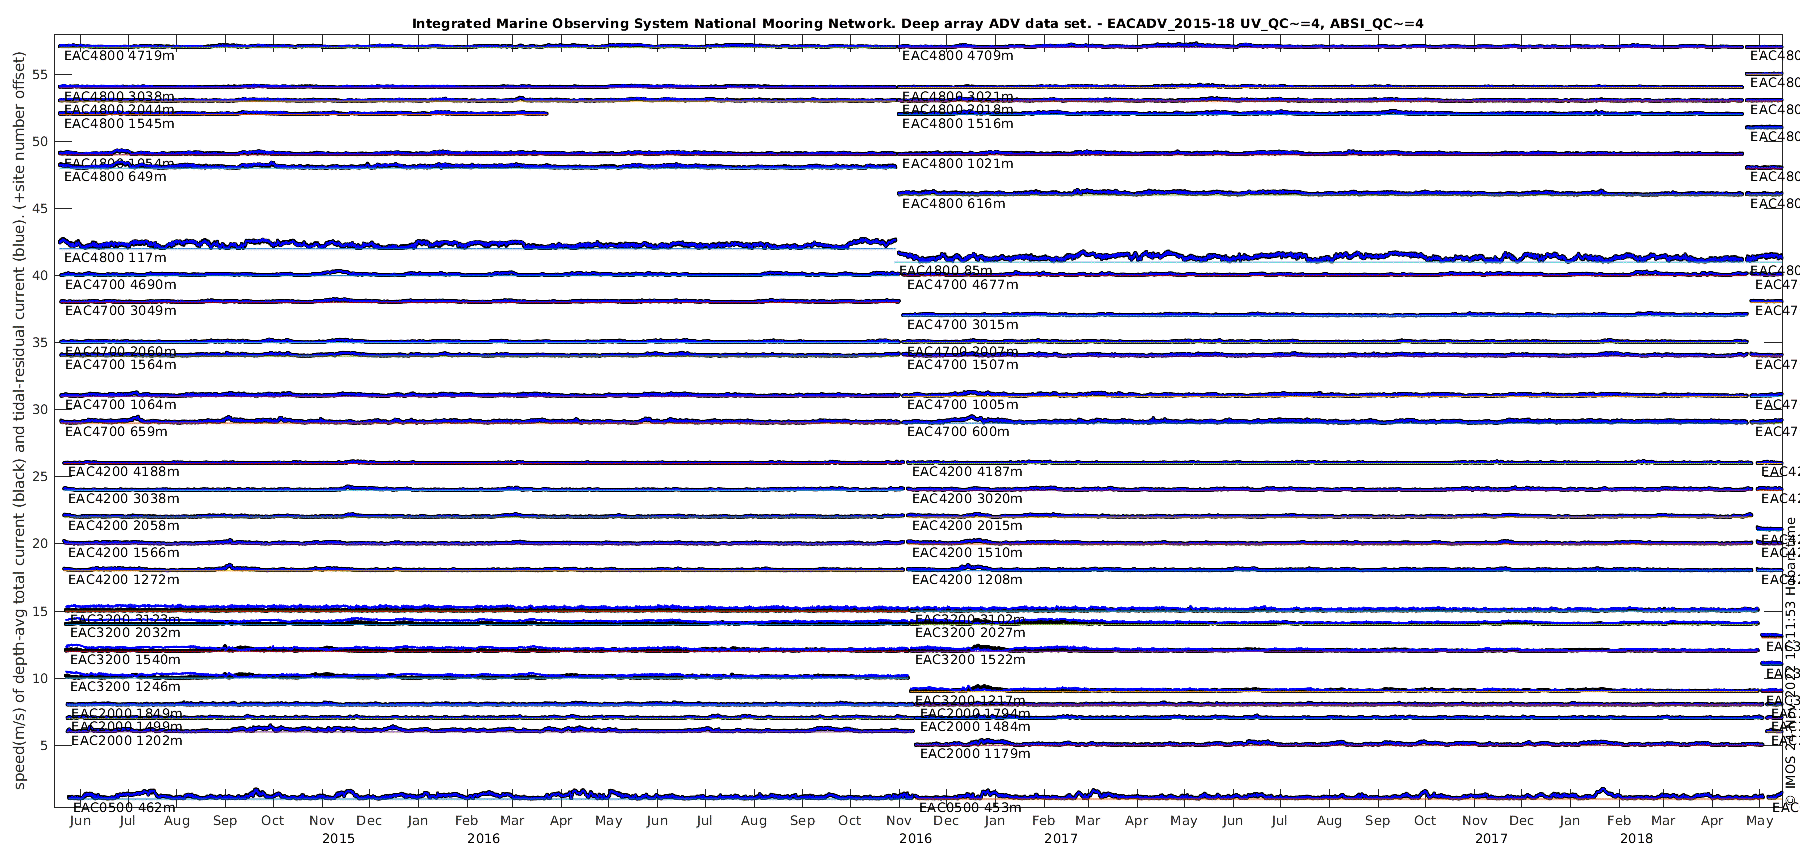
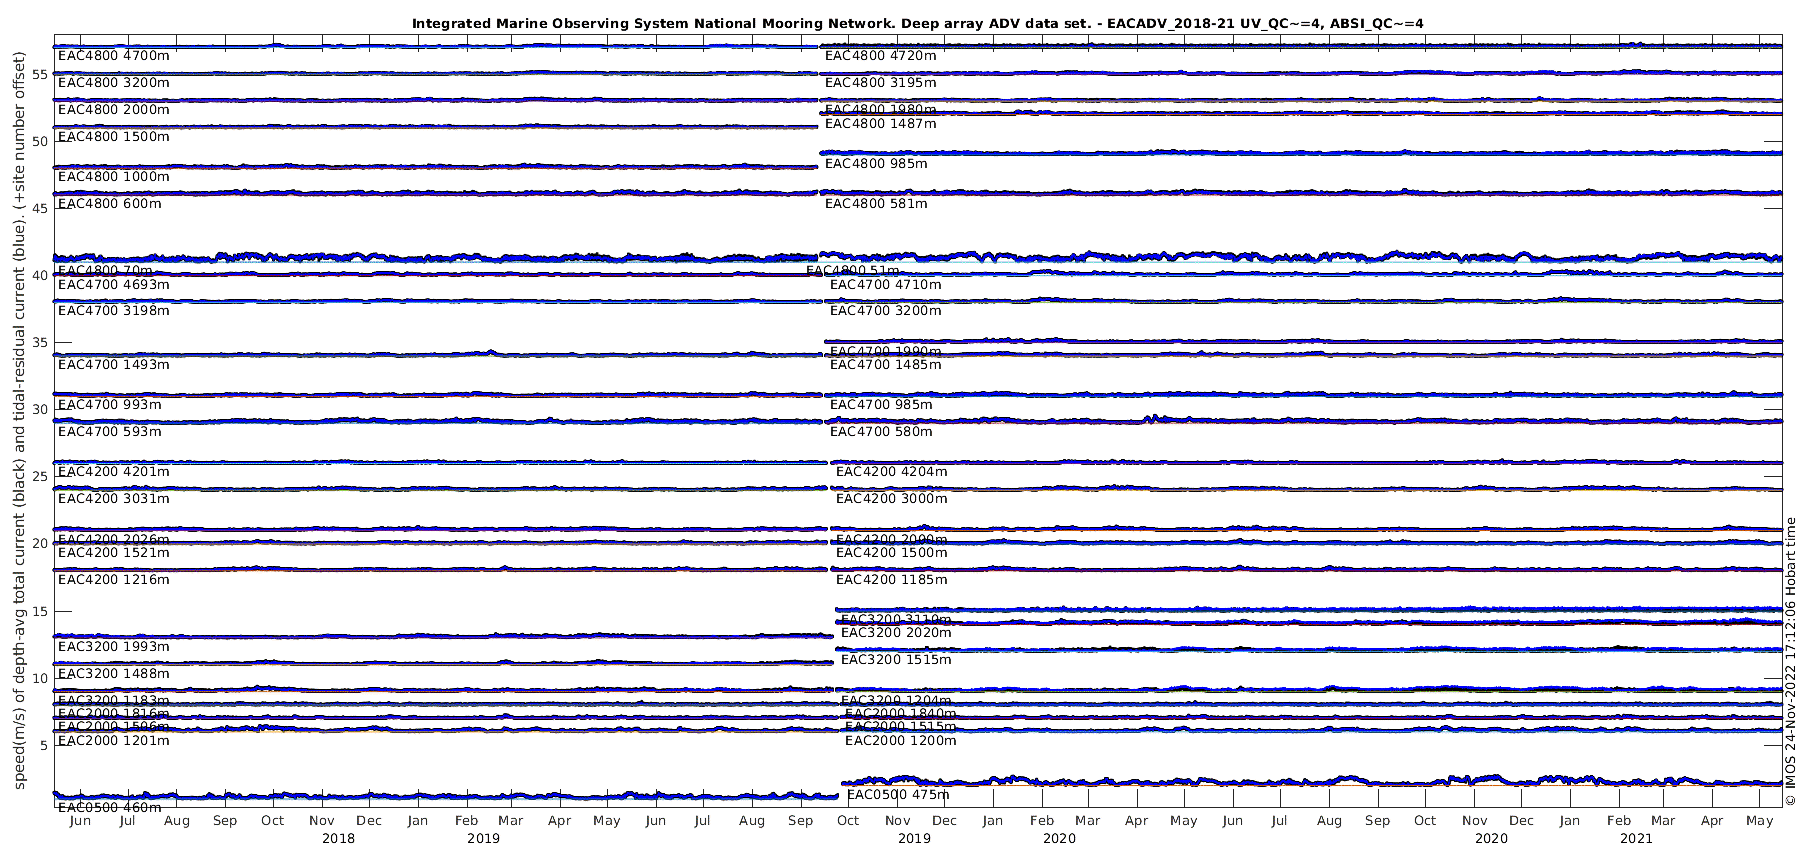
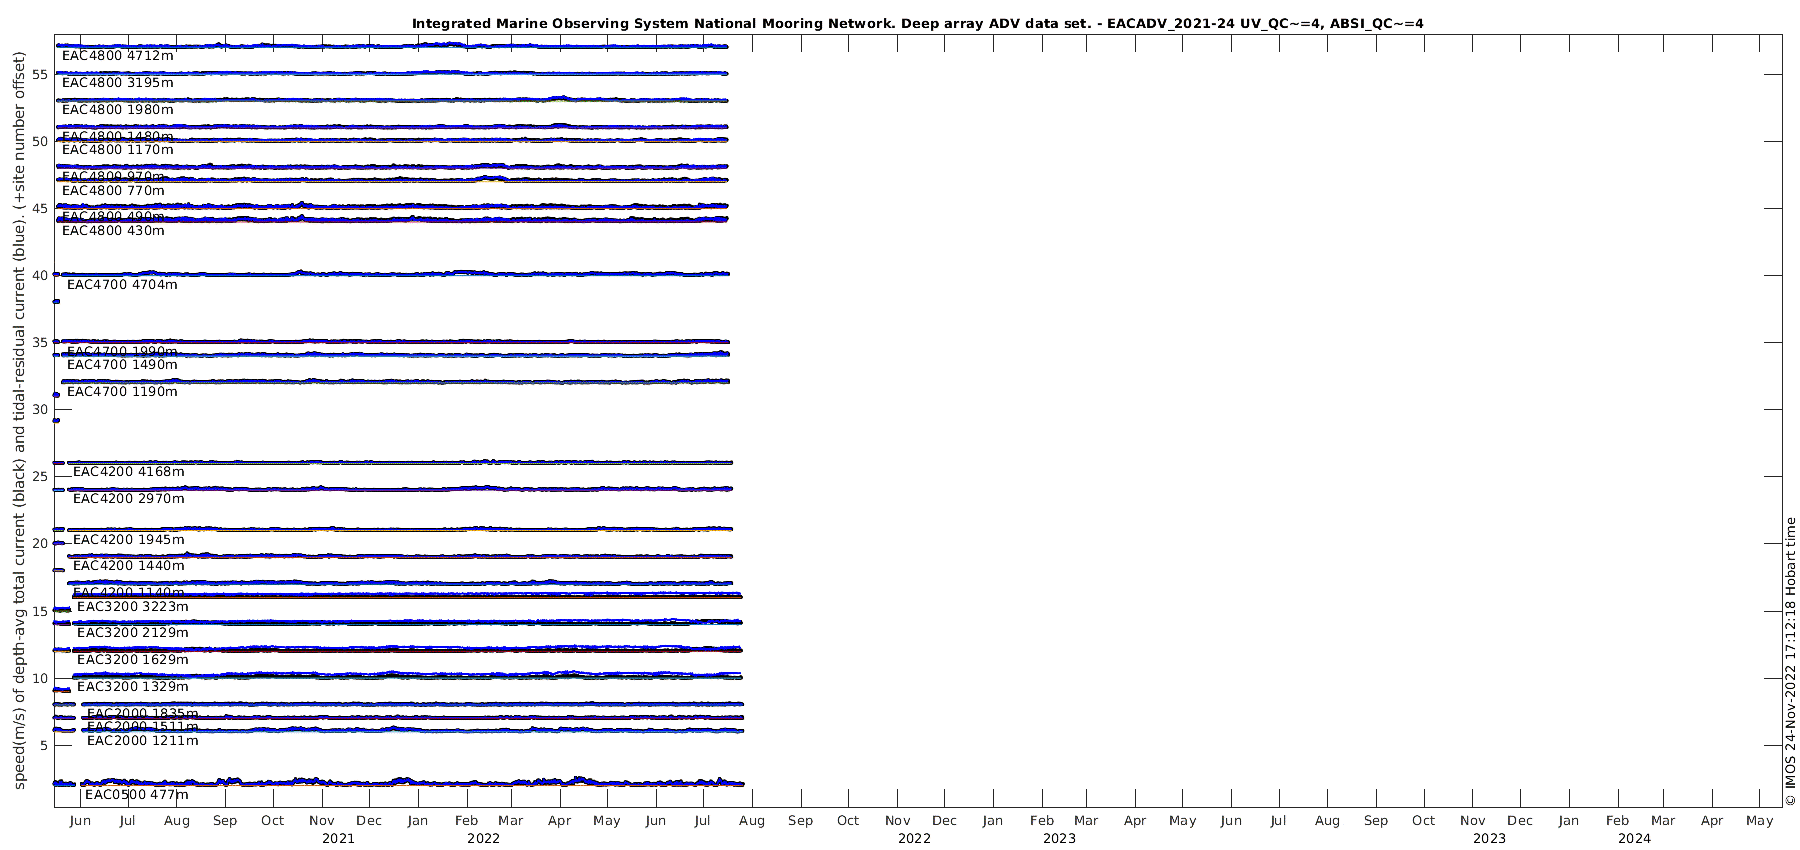
The graphics below summarise the availability of the Deepwater ADV Velocity data at the IMOS data server on 23-Nov-2022 14:08:47
Pages span 3 years each for the ITF and EAC Deep arrays. Choose from the plots below (of the total and tide-residual current speed) then mouse over to display the full filename resulting from a single deployment period. Click above the line to see u,v scatter plots overlain on a map, or under it for a depth-time plot of the data from that deployment. You may then use the [PREV] [NEXT] links to go back and forth in time.
ITF:
EAC:

[top] [ITFADV_2011-15] [ITFADV_2015-18] [ITFADV_2018-21] [ITFADV_2021-24] [EACADV_2011-15] [EACADV_2015-18] [EACADV_2018-21] [EACADV_2021-24]

[top] [ITFADV_2011-15] [ITFADV_2015-18] [ITFADV_2018-21] [ITFADV_2021-24] [EACADV_2011-15] [EACADV_2015-18] [EACADV_2018-21] [EACADV_2021-24]

[top] [ITFADV_2011-15] [ITFADV_2015-18] [ITFADV_2018-21] [ITFADV_2021-24] [EACADV_2011-15] [EACADV_2015-18] [EACADV_2018-21] [EACADV_2021-24]

[top] [ITFADV_2011-15] [ITFADV_2015-18] [ITFADV_2018-21] [ITFADV_2021-24] [EACADV_2011-15] [EACADV_2015-18] [EACADV_2018-21] [EACADV_2021-24]

[top] [ITFADV_2011-15] [ITFADV_2015-18] [ITFADV_2018-21] [ITFADV_2021-24] [EACADV_2011-15] [EACADV_2015-18] [EACADV_2018-21] [EACADV_2021-24]

[top] [ITFADV_2011-15] [ITFADV_2015-18] [ITFADV_2018-21] [ITFADV_2021-24] [EACADV_2011-15] [EACADV_2015-18] [EACADV_2018-21] [EACADV_2021-24]

[top] [ITFADV_2011-15] [ITFADV_2015-18] [ITFADV_2018-21] [ITFADV_2021-24] [EACADV_2011-15] [EACADV_2015-18] [EACADV_2018-21] [EACADV_2021-24]

[top] [ITFADV_2011-15] [ITFADV_2015-18] [ITFADV_2018-21] [ITFADV_2021-24] [EACADV_2011-15] [EACADV_2015-18] [EACADV_2018-21] [EACADV_2021-24]
Updated: 23-Nov-2022 14:08:47


