
Obsolete page! please update your bookmark to our present address
OceanCurrent - Ocean Surface Currents and Temperature
Ocean News:
Technical News:
Launch of OceanCurrent2.0 (27 March 2015): [more ...]
Prepared maps and animations
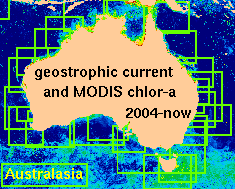
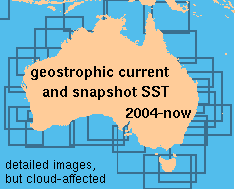
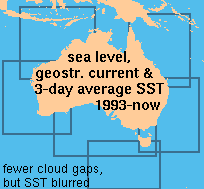
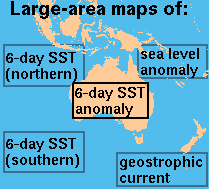
[Source Data] [what's shown] [animation won't play?]
Imagery for import into Google Earth
 [West Australia, last 6 days] [2008-now]
[East Australia, last 6 days] [2008-now]
Click one of these links to make a map of the anomaly of 3-day average SST for WA or East Australia appear in Google Earth. If you select the 'last 6 days' link, drag the time slider right to see the most recent data. For either recent or old, zoom in to see 'snapshot' images of SST anomaly,
overlain with altimeter-derived estimates of currents. Move the time slider slowly to load other days' data. Tip: Do not save this to My Places in GE. To refresh tomorrow, reload from the website.
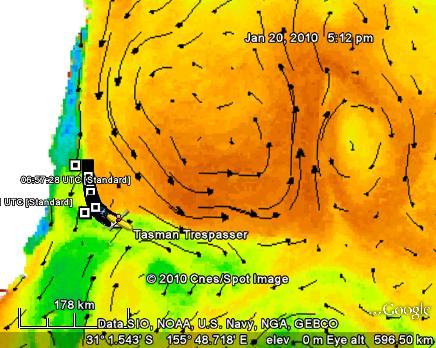
The GE screenshot at left [expand] shows an ocean rower positioning himself to get a free ride with the current, as an example of how GE enables you to combine information from several sources.
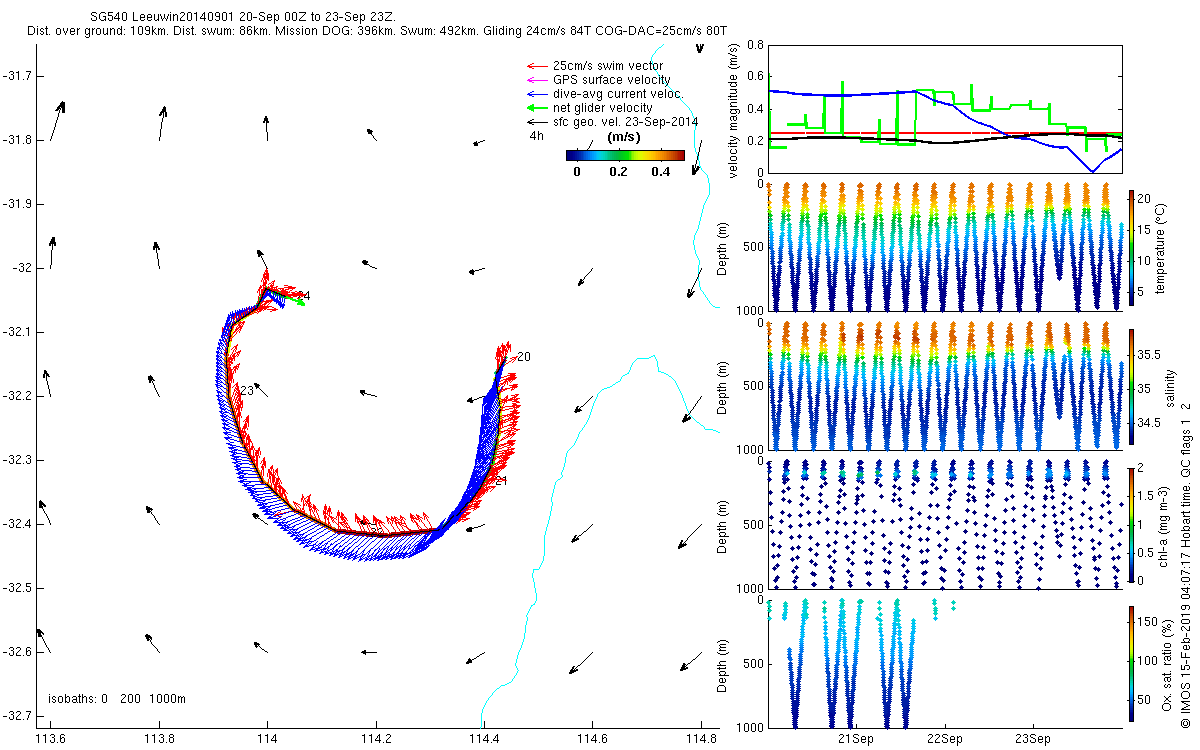
Argo temperature and salinity Moored current meters Gliders

Access to data files
[IMOS data portal] [Near-Real-Time gridded altimetry via OPeNDAP] [Delayed-Mode gridded altimetry via OPeNDAP] [IMOS Satellite Remote Sensing Facility]
Methods
[Technical details] [Glossary] [References] [Acknowledgements]
If you've found this information useful, see something wrong, or have a suggestion, please let us know. All feedback is very welcome. If the website seems not to function at all, please contact info@aodn.org.au, noting that our systems are not monitored 24/7 (being research infrastructure rather than operational).

© 2011 IMOS
Use of this web site and information available from it is subject to our
[Conditions of use]


 [West Australia, last 6 days] [2008-now]
[East Australia, last 6 days] [2008-now]


