OceanCurrent - current meters

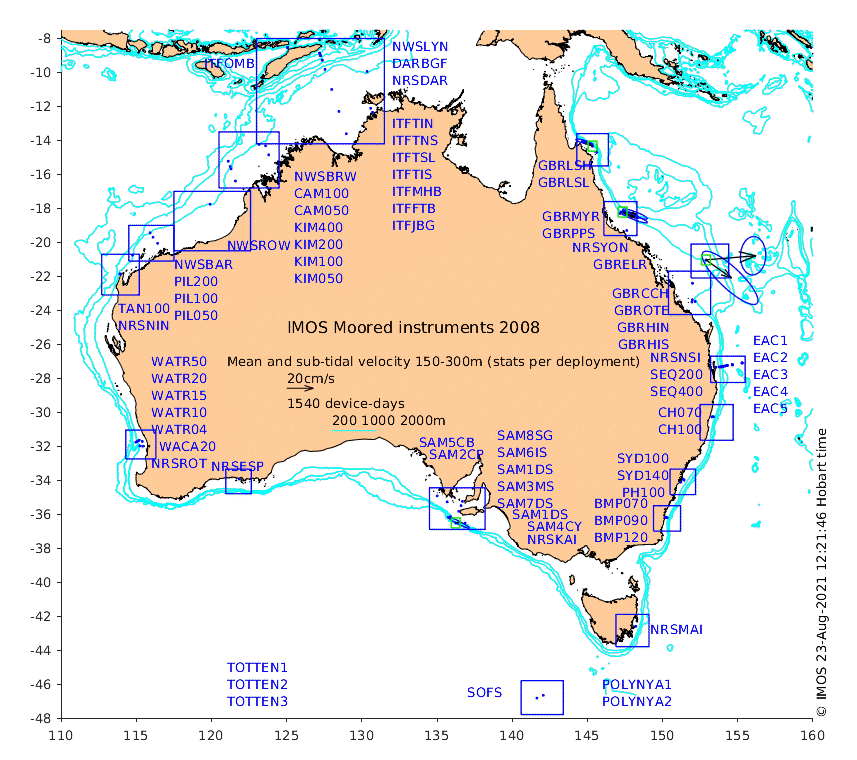
Moored instrument array 2008

These maps show some basic analyses of the velocity data: mean and sub-tidal variance for several layers and time-windows, and tidal harmonics for the depth-average velocity using the whole record. Click through to see more detailed plots of the selected dataset or to download those data from the AODN thredds server.

Region Aust TimorP Kim Row Pil Ning Perth Esp SA Totten SOFS Polynya ETas BMP Syd Coffs SEQ SGBR SGBR2 CGBR NGBR
Time 2007-2021 2007 2009
Property vmean vrms
depth layer 0-4800m 0-30m 30-80m 80-150m 150-300m 300-600m 600-1200m 1200-2200m 2200-4800m

ITFOMB ITFTIN ITFTNS ITFTSL ITFTIS ITFMHB ITFFTB ITFJBG NWSLYN DARBGF NRSDAR NWSBRW CAM100 CAM050 KIM400 KIM200 KIM100 KIM050 NWSROW NWSBAR PIL200 PIL100 PIL050 WATR50 WATR20 WATR15 WATR10 WATR04 WACA20 SAM5CB SAM2CP SAM8SG SAM6IS SAM1DS SAM3MS SAM7DS SAM1DS SAM4CY GBRLSH GBRLSL GBRMYR GBRPPS GBRELR GBRCCH GBROTE GBRHIN GBRHIS CH070 CH100 SYD100 SYD140 PH100 BMP070 BMP090 BMP120 TAN100 NRSNIN NRSNSI SEQ200 SEQ400 NRSYON NRSROT NRSMAI NRSKAI NRSESP EAC1 EAC2 EAC3 EAC4 EAC5 TOTTEN1 TOTTEN2 TOTTEN3 POLYNYA1 POLYNYA2 SOFS GBRLSL GBRMYR GBRELR SAM1DS TimorP Kim Row Pil Ning Perth Esp SA Totten SOFS Polynya ETas BMP Syd Coffs SEQ SGBR SGBR2 CGBR NGBR