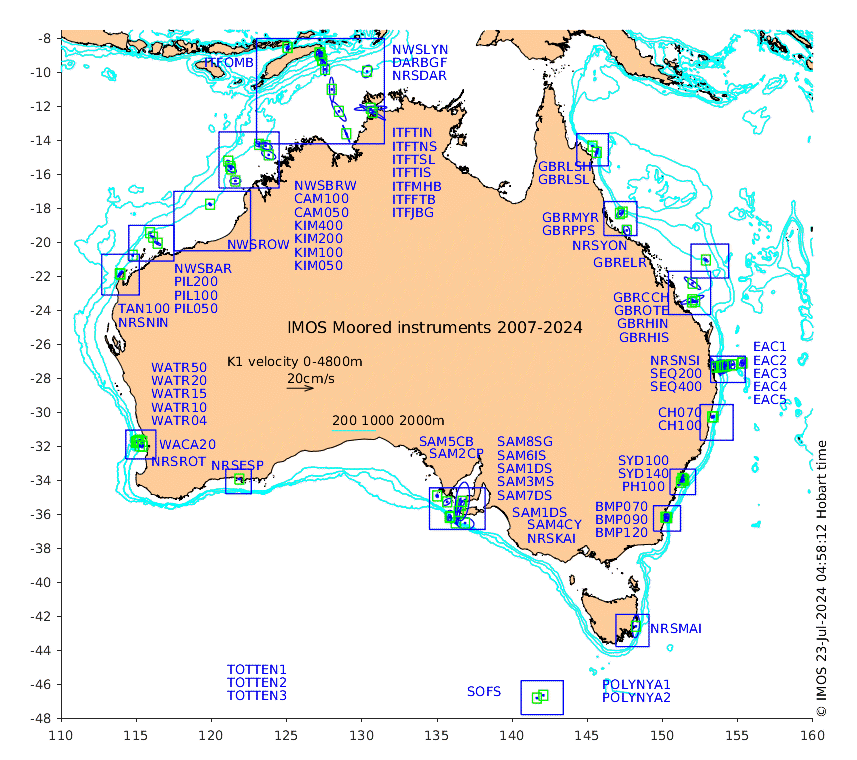
These maps show some basic analyses of the velocity data: mean (all-time in black and seasonal in colour) and sub-tidal variance for several layers and time-windows, and tidal harmonics for the depth-average velocity using the whole record. Click through to see more detailed plots of the selected dataset or to download those data from the AODN thredds server.
Region Aust TimorP Kim Row Pil Ning Perth Esp SA Totten SOFS Polynya ETas BMP Syd Coffs SEQ SGBR SGBR2 CGBR NGBR
Time 2007-2024
Property vmean vrms M2 S2 N2 O1 K1
depth layer 0-4800m
