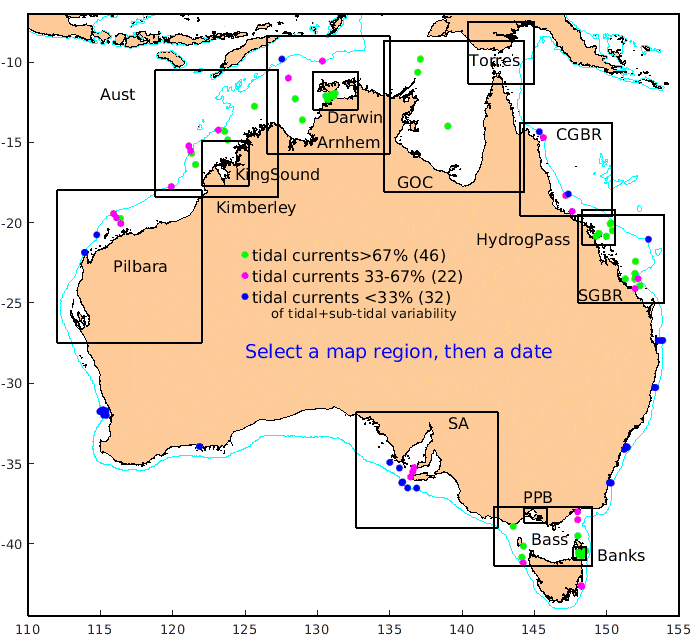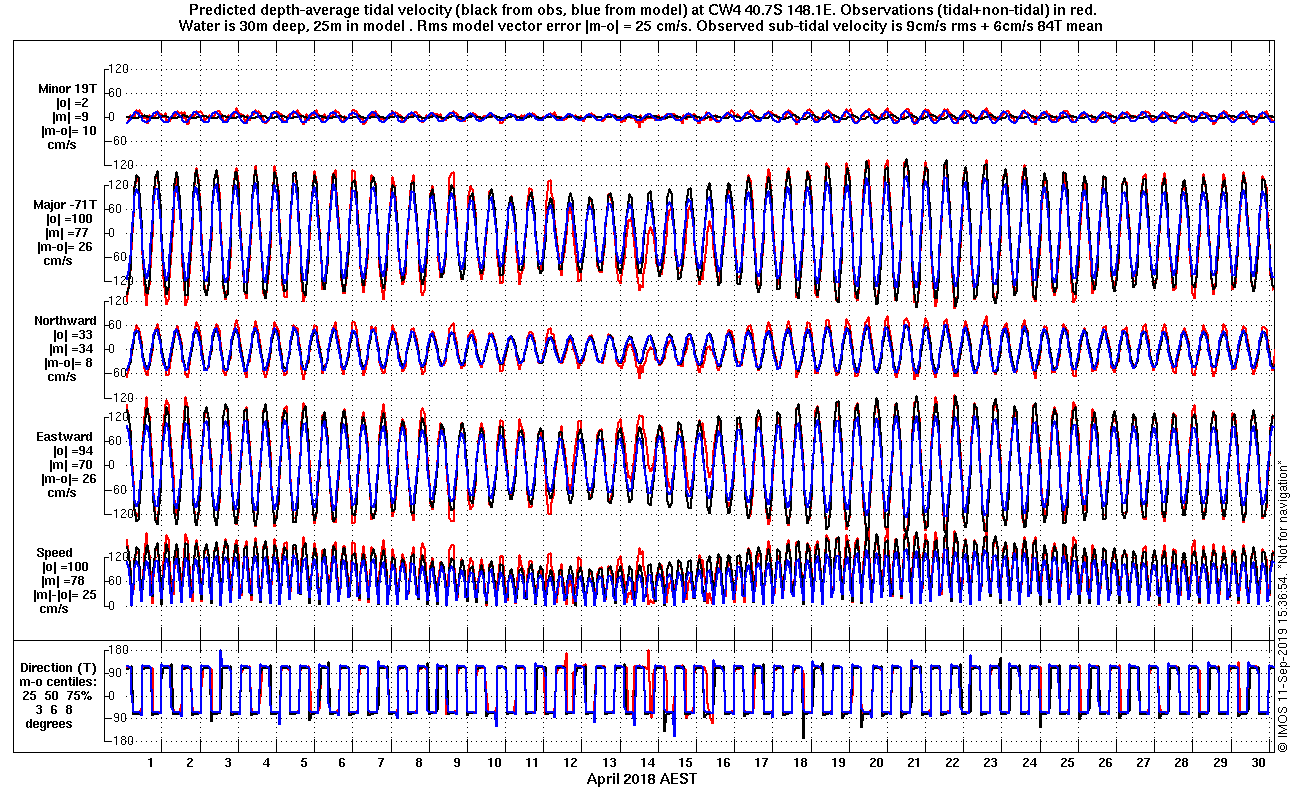


| 2) Month-per-page graphs | For each current meter or tide gauge, these graphs compare the observation-based tidal predictions ('o' for short) with co-located model-based tidal predictions ('m'). The current velocities are shown as speed and direction, and components along East, North and the major and minor axes of the observed M2 tidal ellipse. The agreement of o and m is characterised by listing rms values of each separately, as well as of the model error m-o. For currents this is done for the scalar components as well as for the vector difference. If the vector error can be reduced by lagging or advancing the model, details are given. The direction error is characterised by listing the 25th, 50th and 75th percentiles. The [PREV] and [NEXT] links step a month at a time (or to an adjacent location if the next month is not done yet), or back to when actual observations can be included on the graph (1983 in some cases). Browsing the graphs with actual observations reveals how Australia's ocean currents range from tidally-dominated (e.g. in Bass Strait as shown at right), to mixed (e.g. Palm Passage) to non-tidal, such as off Bateman's Bay. |
 |
|---|
Sept. 2019 Opening announcement.
Sept. 2023 Focus on slack tides.
 A novel aspect of the work presented here is the presentation and assessment of predictions of depth-averaged tidal currents (sea level information is included for completeness rather than novelty, and does not replace the predictions published by the National Operations Centre (NOC) Tidal Unit of the Bureau of Meteorology). The observation-based predictions of tidal current are made at 100 locations around Australia, using
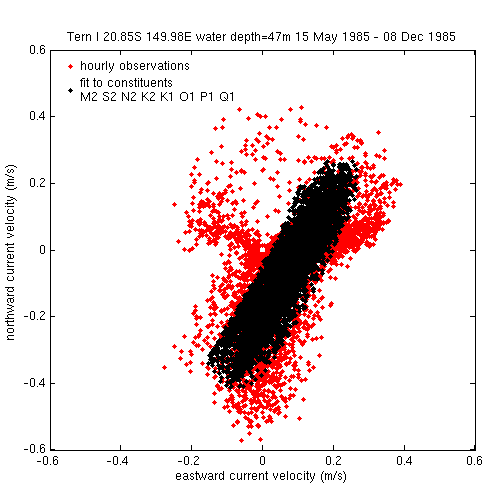
We have used the UTide tidal analysis software of Codiga (2011) to compute amplitudes and phases for up to 8 (depending on the record length) semi-diurnal and diurnal (M2 S2 N2 K2 O1 K1 P1 and Q1) tidal velocity constituents (details for IMOS sites), allowing predictions to then be made for any chosen period.
In contrast to the situation with tidal currents, predictions of tidal sea level are already widely available and heavily used. We obtained tide gauge data from
There are 3 main reasons why there are not presently many 'official predictions' of tidal currents to accompany the predictions of tidal height published, for example, by the BoM (see the 'Tidal streams' button):
Models like eReefs simulate both tidal and non-tidal currents, and similar models are also being constructed for other regions around Australia. Regardless of these developments, however, we think there is value in publishing predictions of the tidal component of the currents without attempting to include the non-tidal component.
tide The term 'tide' is sometimes used to describe any variation of the sea level or the current. Here, we use the oceanographer's definition, which is that the tide is the astronomically forced variation of sea level and current. Hence, and in contrast to the non-tidal variability in the ocean, the tides are equally predictable for any period in the future (or the past), because the tidal forcing is precisely linked to the orbit and rotation of the Earth and the orbit of the moon.
tidal prediction The most accurate way to predict the tides (currents or sea level) at a certain location is to obtain a record of the tides for a period then do what is known as a tidal analysis to determine the amplitudes and phases of all the tidal constituents, then a prediction, which is the reverse operation. We have used the TTide and UTide matlab software for this. To make a prediction for a location where no observations exist, one has to use a tidal model, either a global model such as TPXO9 or FES2014, or a regional model such as the CSIRO tidal model. This is because the ocean's response to the tidal forcing is very complicated, due to the complex shape of the oceans, coastal seas and continental shelves. Local resonances can increase the amplitude of the tides in some places, while destructive interference can reduce it elsewhere. These dynamics are frequency-dependent, affecting the diurnal and semi-diurnal tides differently. The relationship of currents to heights is also complex. Strong tidal currents do tend to occur in regions with high tidal sea level amplitudes, but at some distance away from where the range is greatest, and not always at the time you might expect.
tidal constituent For most locations, the dominant tidal constituent is M2. This measures the amplitude of the sea level perturbations towards the moon on one side of the earth, and away from it on the other. Taking the rotation of the earth and the orbit of the moon into account, this constituent has a period of 12h 25min 14.4s. The dominant constituent associated with the sun is called S2, and has a period of exactly 12h. The 50.5 minutes-per-day difference of these two periodic signals is what gives us the 28.5d spring-neap cycle of the daily tidal range (and the waxing and waning of the moon). There are 145 named tidal constituents, together accounting for the complex but periodic cycle of the tides.
tidal ellipse Being a vector (two dimensional) quantity, tidal currents are more difficult to describe than tidal sea level. For each tidal constituent, the tidal current velocity vector traces out an ellipse. It is only in narrow channels that the current goes simply back and forth. In some places, the ellipse is close to a circle, with the speed of the current remaining constant, and only the direction changing. More commonly, the amplitude of the major axis is significantly greater than the amplitude of the minor axis. The bearing of the major axis is commonly referred to as the direction of the flooding tide.
diurnal and semi-diurnal Diurnal tidal constituents (e.g. O1, K1) have periods near 24-25h. They are smaller than the semi-diurnal (near 12h) constituents in most places, the SA Gulfs being a notable exception, where the K1 currents are stronger than the M2 currents. They are caused by the asymmetry of the sea level perturbations on the near and far sides of the Earth.
long-period tides These are constituents with periods near 15d, 30d, 6 months and 12 months. Some are due to direct astronomical forcing (i.e. non-colinearity of orbital axes, eccentric orbits, etc) while others are due to the non-linearity of the ocean response to the astronomical forcing. Neither sort of long-period tide are included in the predictions shown here. They are small compared to the errors of the short-period tides.
non-tidal variability Broadly speaking, this refers to the many other causes of ocean currents and sea level changes, such as wind, atmospheric pressure, heat gain or loss, freshwater gain or loss and eddies at a wide range of sizes. There are, however, a few grey areas. Tidal currents rushing past a headland may spin up an eddy, depending on the state of the spring neap cycle or the existence of a large-scale alongshore current. That eddy is clearly caused by the tide, but it is unpredictable. Conversely, the regular daily cycle of winds and temperature, modulated on the annual timescale, also causes a fairly predictable signal in observations of the ocean, which tidal analysis software inevitably includes in its estimation of some of the diurnal and annual tidal constituents.
slack tide (a.k.a. "slack water") is the time when the tidal current turns from ebbing to flooding, or vice versa, i.e., it is the time when the speed of the tidal current is at a local minimum. The timing of slack tide relative to high and low water depends on location, as mentioned in our September 2023 news item.
sub-tidal variability is due solely to physical processes operating at time scales longer than a day or so (i.e. excluding semi-diurnal and diurnal tides). We estimate the rms amplitude of these by applying a Hanning filter to the observations with a half-amplitude width of 20h. This filtering removes all semi-diurnal variability, not just the phase-locked components at resolvable frequencies. From the prediction point of view, the historical amplitude of sub-tidal variability is an estimate of prediction error, since the actual sub-tidal variability can only be predicted close to real time using weather and other data.
internal tides In some places, currents associated with the internal tide rival or exceed those due to the barotropic ('normal') tide. These are presently out-of-scope for this website but remain an active area of research because of their importance to everything from climate modelling (because they do vertical mixing and dissipate energy) to offshore engineering (e.g. on the NW shelf). Internal tides occur when the barotropic tide excites wavelike motions of the layers of the ocean with different density. If the amplitude of these waves is large, tidal-period velocities in the upper and lower layers can be in the opposite direction. Internal tides come and go depending on the stratification of the ocean, so they are harder to predict than the barotropic tide.
rms Root mean square, i.e. sqrt(mean(x^2)) where x comprises N estimates of some quantity (or a difference of two comparable quantities), either scalar (e.g. sea level) or vector (velocity, as u + iv). Here, all quantities considered are tidal predictions, which have zero mean over the time intervals considered. In the case of velocities, the rms values are vectors, only the magnitudes of which are used unless specified otherwise.