Legend
- ○
- Argo
- ◆
- Glider
- ⇉
- Radar
- >
- Drifter
- ○
- Ship
- ●
- Moorings
- ▬
- EAC cumulative
transport
Click for more
information

Legend
transport
EAC Array
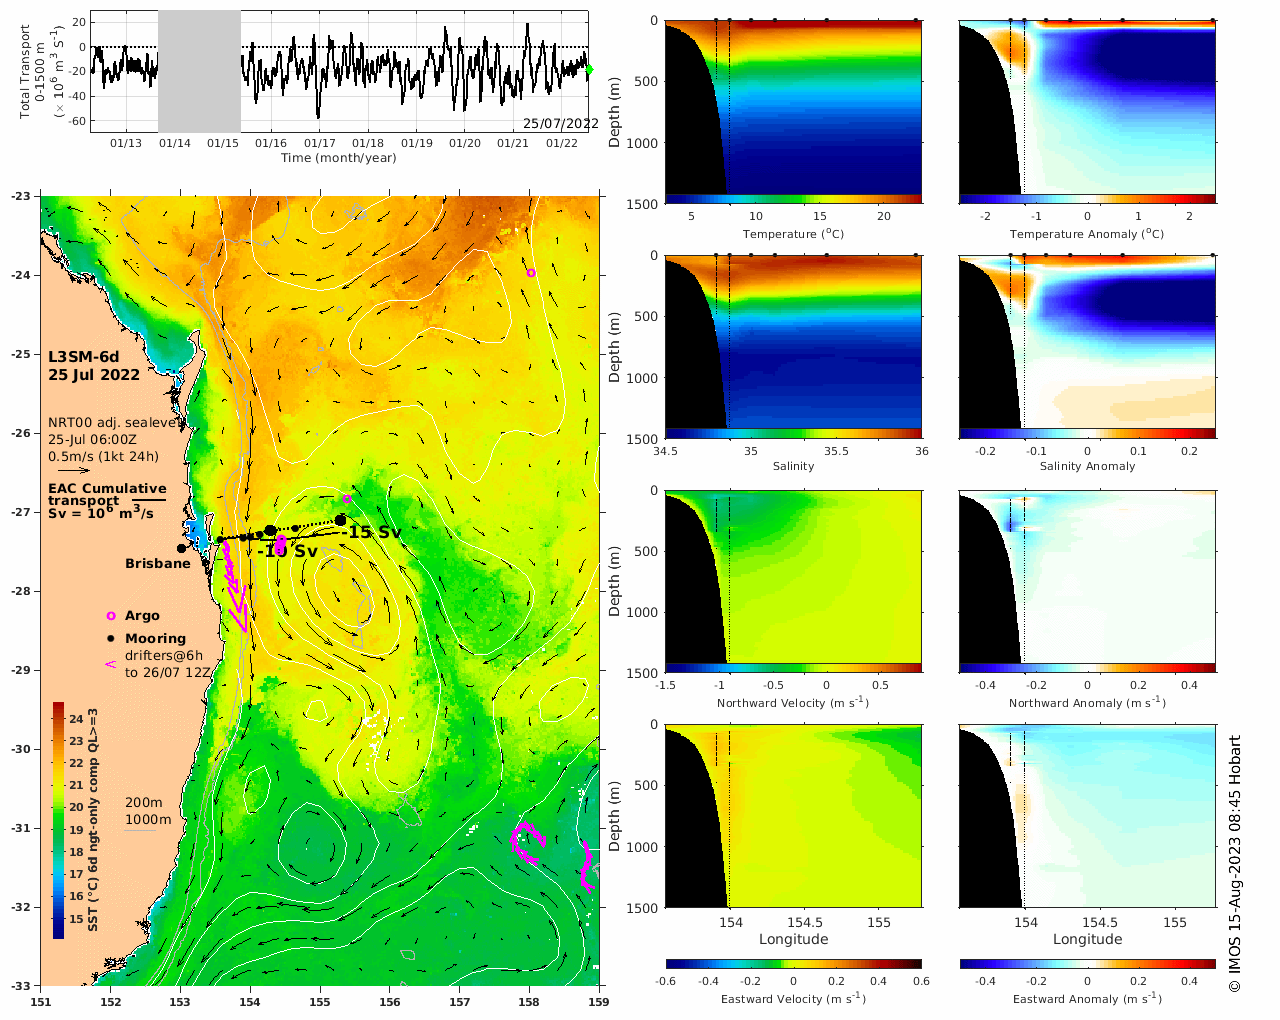
Daily estimates of East Australian Current (EAC) properties calculated from the CSIRO EAC gridded mooring product.
The upper left plot is the time-series of the EAC transport summed from North Stradbroke to the outer EAC mooring and from the sea surface to 1500 m depth (solid black line). The green dot identifies the day being displayed on the page.
The map below is our 6-day Sea Surface Temperature (SST) composite product, with the daily cumulative EAC transport from North Stradbroke to the outer EAC mooring overlain (solid black line). The transport value at the mid-point and end of the distance between North Stradbroke to the outer EAC mooring is provided (numbers written near the larger black dots). Black dots show locations of moorings, with larger black dots indicating the mid-point and end of the array.
The plots on the right show the EAC mooring array temperature, salinity, and northward and eastward velocity interpolated onto a 1-2 km grid along the mooring line segment (black dashed line on SST map). The first column are the daily property sections, and the second column are the anomalies from the 2012-2022 seasonal climatology. The small black dots show the available data at each mooring which are used to create the filled mooring data and EAC gridded data product. The black dots at the surface indicate the SST and sea surface salinity that are included in the gridded product.
Method (CSIRO EAC gridded mooring product): (1) A 5-day filter is applied to the hourly-depth mooring data to remove tides and other high frequency processes. (2) Data are interpolated to a common daily time stamp to create the daily-depth temperature and salinity data. (3) An Iterative Completion Self-Organizing Maps (ITCOMPSOM) method, based on the SOM (Self Organising Maps) neural network machine learning algorithm, is used to fill temporal and vertical data gaps. (4) The filled velocity, temperature and salinity are interpolated onto a 1-2 km regular grid between the North Stradbroke Island and outer EAC mooring.
EAC Array